


Bitcoin price continues to deflate after last week’s BTC ETF rejection. By now most traders will want to know whether or not this is a short-term bear trend, or if BTC is returning to the $6k range indefinitely.
Market Overview
There was a time when the slightest rumor sent tremors through the market and boosted even the most unheard of altcoin by 20% minimum. Alas, it appears that those days have long passed. Outside of the this month’s Bitcoin ETF hype and letdown, very little of this week’s positive bitcoin news translated to growth in price.
The news that a Starbucks partnership with Microsoft which eventually could lead to customers paying for their frappes with Bitcoin seems to have produced a pop above $7,400 Friday morning. However, BTC 00 quickly pulled back. It seems the actual buy a coffee with Bitcoin concept is not as straightforward as it seems. A secondary company will receive a cryptocurrency instantaneously converted to fiat for Starbucks. Nonetheless, a win is a win, and cryptocurrencies need further integration into current payment systems in order to spur wider adoption.
In other news, Robert Sluymer of Fundstrat says that Bitcoin is in a “crucial phase” as it will either bounce off recent lows and keep moving or crumble under pressure and return to $6,000.
The week also provided a dash of controversy as some investors will take a hit once OKEx enacts their “socialized claw-back” policy after the forced liquidation of a massive $433 million futures trade.
And to top things off, the Central Bank of Denmark claims that Bitcoin is not ‘real money,’ while a UBS study suggests that Bitcoin requires a $213,000 per coin valuation to supplant the U.S. Dollar.
FUD or not, Bitcoin appears to be stuck in a bearish rut and it’s going to take a bit of consistent purchasing volume to winch her out.
Now, let’s have a quick look at the charts
Daily Chart
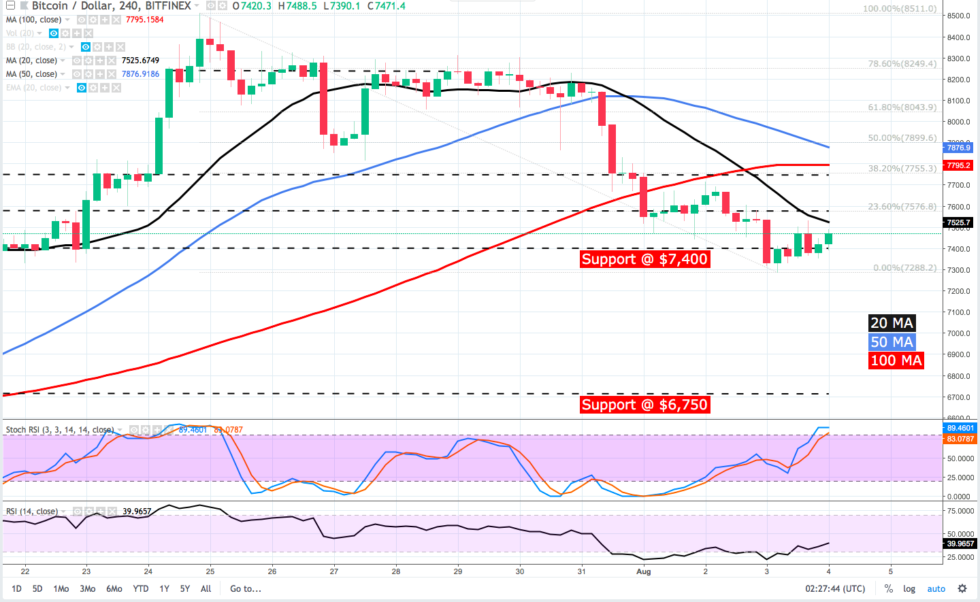
Bitcoin fell to a 2 week low at $7,288 and the weekly chart shows that a lower high was set and BTC appears to be tightening as it consolidates in preparation for a possible breakout to $7,576 which previously functioned as a support and aligns with the 23.6% Fib retracement level.
Gains above $7,576 are likely to extend to $7,753 which also served as a strong support and lines up with the 38.2% Fib retracement but the 100-day MA is sits slightly above this shelf at $7,800 and could push back against further gains as this was a strongly contested resistance a few weeks back.
The 20-day MA has sunk far below the 100 and 50-day MA, suggesting that bulls are in control. Yet, the combination of an ascending trendline from today’s low and a RSI that is now climbing out of bearish territory hints at the possibility of a breakout that could range from $7,550 to $7,750.
Alternatively, a less rosy interpretation of the same 4-hour chart shows BTC consistently being rejected at the short and long-term moving averages, as well as the trend of 4-hour lower highs indicating that bears are at the helm. BTC could spike to the 23.6% or 38.2% resistance, but this would require a move above the 20 and 100-day moving averages.
This could prove to be a challenging situation as the 20 MA is below the $7,575 resistance and the 100 MA is above the the 38.2% Fib retracement level. Below the new low, $7,200 serves as a soft support and is followed by a stiffer support at $6,750.
Daily Chart
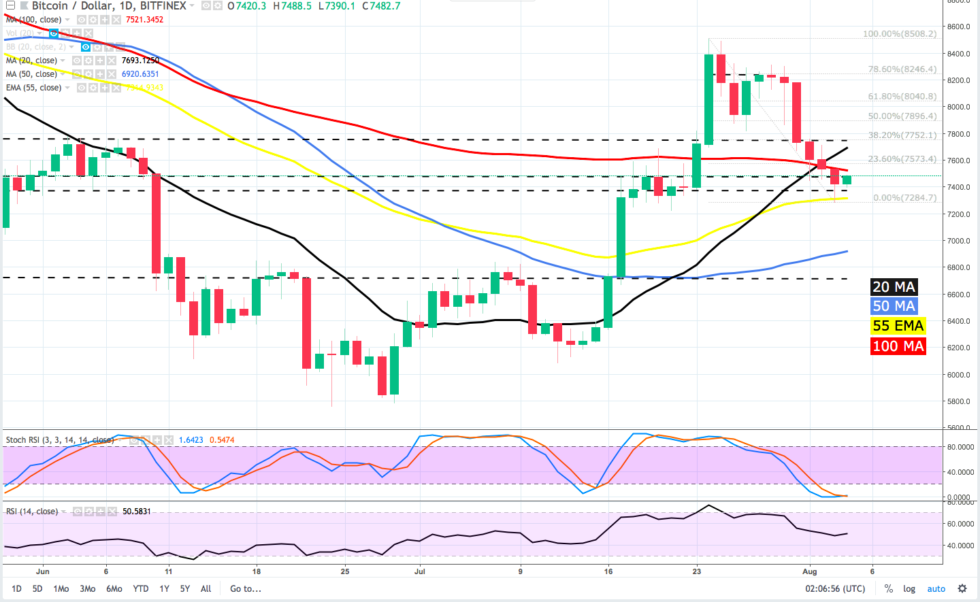
Similar to the 4-hour chart, BTC is pinned between the $7,400 support and the $7,500 resistance overhead. The same pattern of rejections at the moving averages can be seen as BTC continues to meet resistance at the 20 and 100-day MA. At the time of writing the RSI has flatlined right at 50 while the Stoch is long oversold, but a review of the both oscillators on the 4-hour chart supports the possibility of a breakout as described above.
The 55 EMA and 20 MA on the daily chart continue to ascend which lends further validity to the interpretation of the current pullback being a short term bearish trend, but there are few supports below $7,350 – $7,200 so a drop below these point could lead BTC to revisit $6,750.
Looking Ahead
BTC could break out to $7,550 – $7,750 over the next 24 hours but is likely to encounter resistance at $7,800 where the 100-day MA is situated.
Those trading on the 30 minute, 1 hour and 4-hour chart might set their sell orders a little bit short of the moving averages and former supports as there is a pattern of rejection at these points on the 4-hour chart.
This 1-hour chart suggests that failure to hold the $7,400 support will drop BTC to $7,100 – $6,800 but most charts show little support under $7,350 until $6,750.
[Disclaimer: The views expressed in this article are not intended as investment advice. Market data is provided by BITFINEX. The charts for analysis are provided by TradingView.]
Where do you think Bitcoin price will go this weekend? Let us know in the comments below!
Images courtesy of Tradingview.com, Shutterstock

