


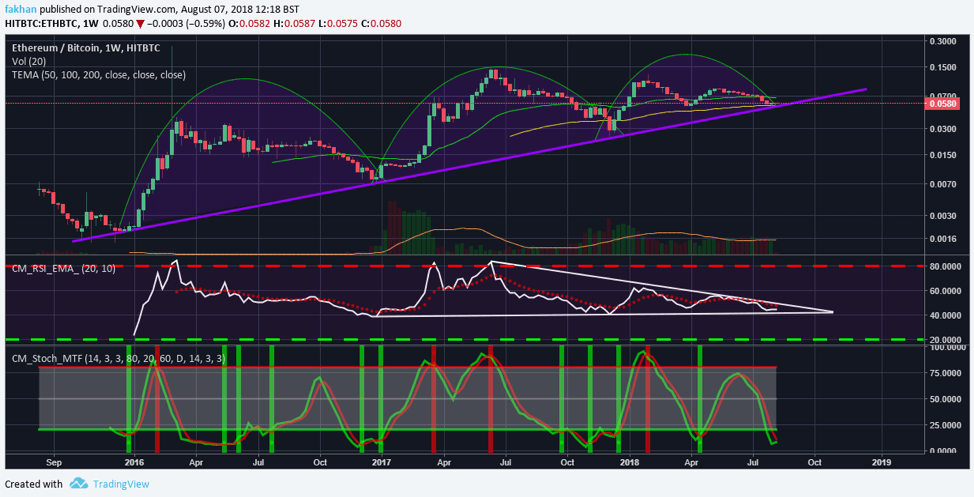
Ethereum (ETH) seems to have found a bottom against Bitcoin (BTC) according to the ETH/BTC weekly chart above. The price action has so far respected the long term trend line since before 2016. Ethereum (ETH) has now completed three cycles against Bitcoin (BTC). The first cycle was the longest and third the shortest. It is likely that the cycle that follows after this might be a big one and could extend all the way to Q1 of 2019. RSI looks favorable for a run up as it is likely to soon break out of the triangle it is trading it. Stochastic conditions for ETH/BTC also look favorable as currently oversold conditions are starting to shift in favor of the bulls.
Volume is starting to build up as money flows into the market. Ethereum (ETH) is perhaps the only cryptocurrency that has effectively respected technical analysis since the beginning of this correction. This could be attributed to the fact that there are no Ethereum Futures to allow investors to manipulate the price of Ethereum (ETH). Besides, the market cap of Ethereum (ETH) is large enough to be manipulated on exchanges like some low cap altcoin. This is also why Ethereum (ETH) is a better indicator of price action of the market in general and most altcoins in particular.
Ethereum (ETH) has made a name for itself as being the largest platform cryptocurrency. However, its twin brother, Ethereum Classic (ETC) is catching up quickly and could soon pose a big threat to its market dominance. Ethereum (ETH) is currently the third largest coin by volume whereas Ethereum Classic (ETC) is the fourth largest coin by volume. When Ethereum Classic (ETC) lands on Coinbase and platforms like Robinhood, it is likely that Ethereum Classic (ETC) might end up ranking next to Ethereum (ETH) in terms of market cap. So, unless Ethereum (ETH) has anything to set itself apart from the competition, it is not likely to perform the same way in future as it did in the past.
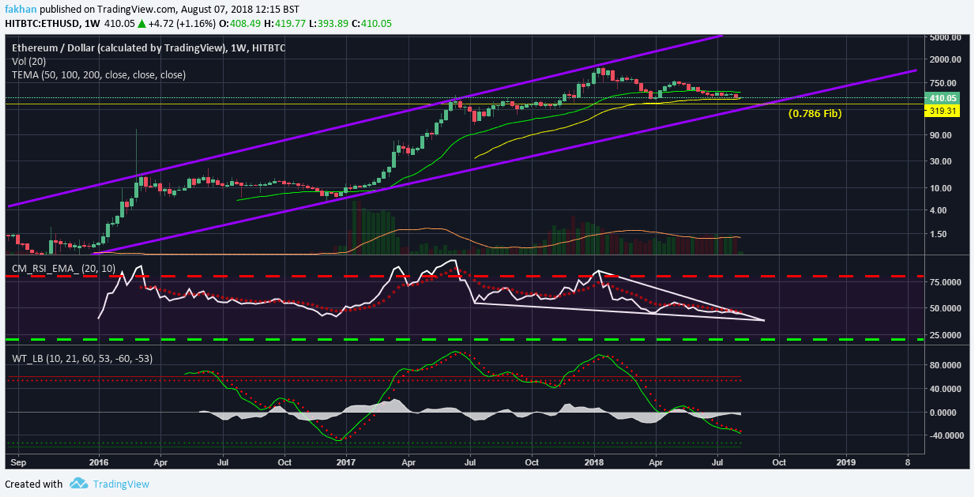
The above chart for ETH/USD shows that the price could retrace to 78.6% Fibonacci level in the near future in order to find a bottom. Overall technical indicators seem very favorable for bullish momentum in the weeks ahead. RSI is currently trading in a falling wedge and hovering below 50. Wave trend analysis also shows that the price is near the bottom but it has not bottomed out yet. All indicators point to a final wave down to $320 to mark the end of this correction.
Ethereum (ETH) is currently up 0.69% in the last 24 hours. The price has had a correction of 71.6% from its all time high. A drop to $320 would mean a correction of 78%. Ethereum (ETH) is still up 52.4% for the last 12 months and 7,600% since 2015. Wave trend analysis for ETH/USD shows that the price could soon be at the same point as in 2017, before the big run up when it traded close to $11.

