


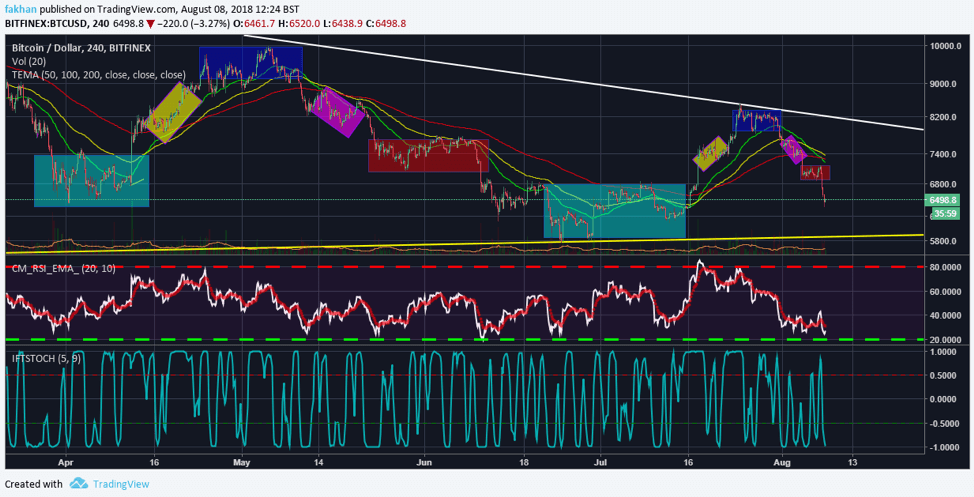
Bitcoin (BTC) has fallen sharply in the last 24 hours on news of the SEC delaying its decision regarding the VanEck/SolidX Bitcoin ETF till September. The 4H chart above for BTC/USD shows that while the news served as a catalyst for yesterday’s price action, Bitcoin (BTC) would have eventually followed the same pattern as major trading activity is still dominated by bots. Fractal analysis of the above chart shows how closely Bitcoin (BTC) is following the same pattern that it followed between April and June. The timeframe however has decreased as Bitcoin (BTC) is now trading further along in a triangle and is poised to break out above or below it in the near future.
RSI conditions on the 4H chart for Bitcoin (BTC) are heavily oversold and signal a recovery at this point. IFT Stochastic conditions also support a short term rally at this point, one that would reproduce the same fractal as before but with narrower timeframes. Lack of significant trading volume on exchanges has allowed bots to shape the direction of the market. These bots generally do not care about the long term outlook or direction of the market. They simply buy low and sell high. Lack of trading volume on most exchanges has also made it easy for the average investor to spot bot activity.
If you browse through the order books for Bitcoin (BTC) on large exchanges like Bitfinex or Poloniex, you will see some orders on both sides of the order book. For instance, you would see an order for 1.263705 BTC on the buy side and you would then see the same amount of 1.263705 BTC on the sell side. The difference is in the price. You would see for instance that a bot has placed a buy order for 1.263705 BTC at a price of $6,510 and a sell order for 1.263705 BTC at $6620. In times like these when the volume is low, bots can easily manipulate markets whichever way they are programmed to.
So, if market makers want to drive the price down, they will put pressure by pilling up fake orders on the sell side. This creates a big sell wall and scare amateur investors into selling their Bitcoin (BTC) to these whales, successfully falling for their schemes. As for market makers, there are big pools of investors who provide liquidity to most of these large exchanges. When the volume is low, it is up to these market makers to keep the order books active. So, even if they manipulate the price every now and then, exchanges often turn a blind eye because they need these market makers at times of low volume.
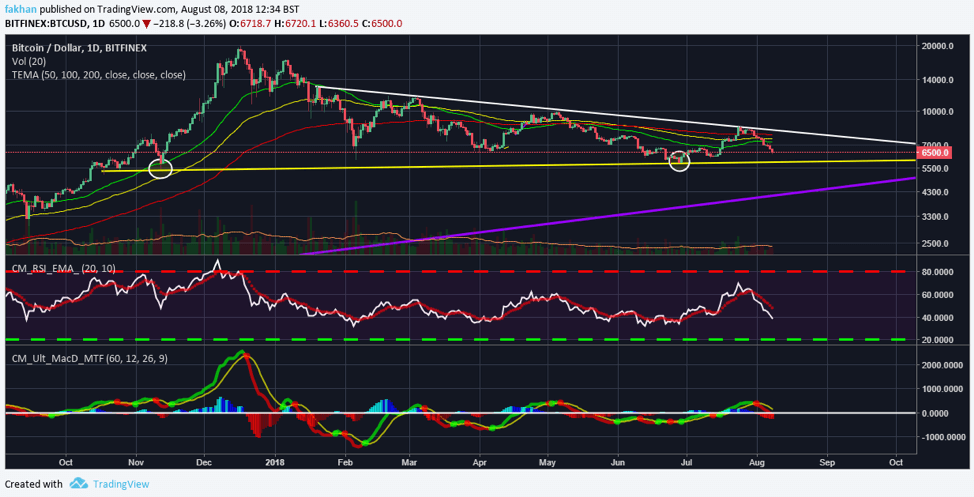
While most indicators on the 4H chart favor a short term reversal as oversold conditions are reached, the daily chart above for BTC/USD shows that Bitcoin (BTC) still has enough room to fall further. RSI conditions on the daily chart show signs of weakness and room for further downside. MACD on the other hand presents a more severe scenario indicating that Bitcoin (BTC) can fall sharply till September. Trading volume has shown signs of improvement but Bitcoin (BTC) is likely to continue falling further unless it finds a bottom to mark an end to this correction and begin a new cycle.
