


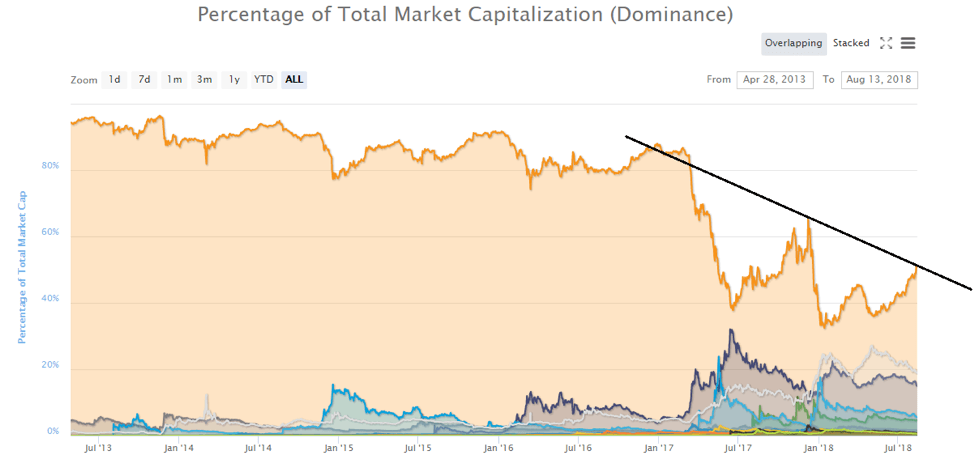
Bitcoin (BTC) has run into a historical dominance resistance. The chart above shows that Bitcoin (BTC)’s dominance is in a constant downtrend since January 2017, the month when altcoins first began to challenge Bitcoin (BTC)’s dominance. Bitcoin (BTC) has shown strength the past few days but recent events, particularly ETF rejections and delays have made it abundantly clear that this time will be no different and that Bitcoin (BTC) will do what it has done over the years, that is follow a cycle of decline against altcoins followed by a cycle of rise against altcoins.
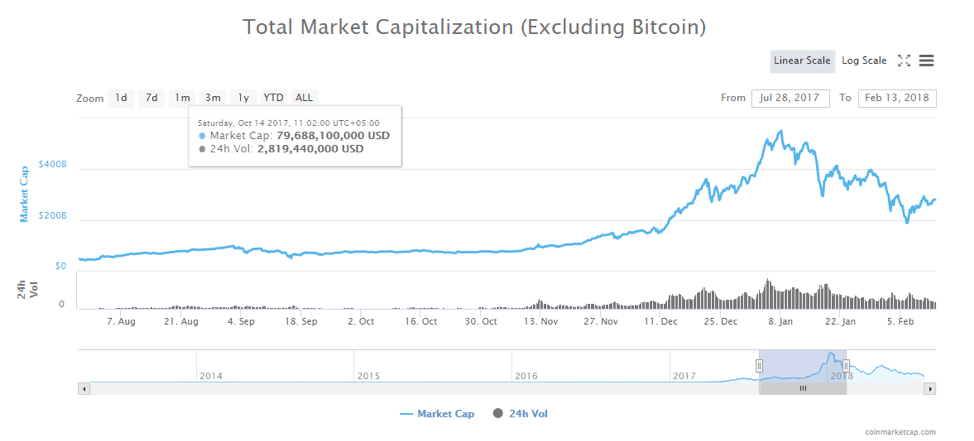
The chart above for total market cap of cryptocurrencies excluding Bitcoin (BTC) shows that altcoins have done well in times of declining Bitcoin (BTC) dominance. For instance, during Dec 2017 and January 2018, when Bitcoin (BTC) reached a new dominance low, altcoins reached a new high. Most cryptocurrencies made more than 10x gains and debates of flippening (Ethereum overtaking Bitcoin in market cap) became common in the crypto community. The market cap difference between Bitcoin (BTC) and Ethereum (ETH) was so low that many actually believed that a flippening could happen. Websites to calculate flippening were created and crypto enthusiast would track then on a daily basis to see when Ethereum (ETH) might overtake Bitcoin (BTC) in terms of market cap.
During that time, Bitcoin (BTC) was compared to Myspace and Ethereum (ETH) to Facebook, with many arguing that Ethereum (ETH) is a lot better than Bitcoin (BTC) as you can create Dapps and smart contracts on it in addition to using it for exchange of value. Bitcoin (BTC) is currently at a similar point. Its market dominance I about to go down again and similar debates will surface again. Bitcoin (BTC)’s dominance will most likely continue to remain in a downtrend till the next halvening in 2020.
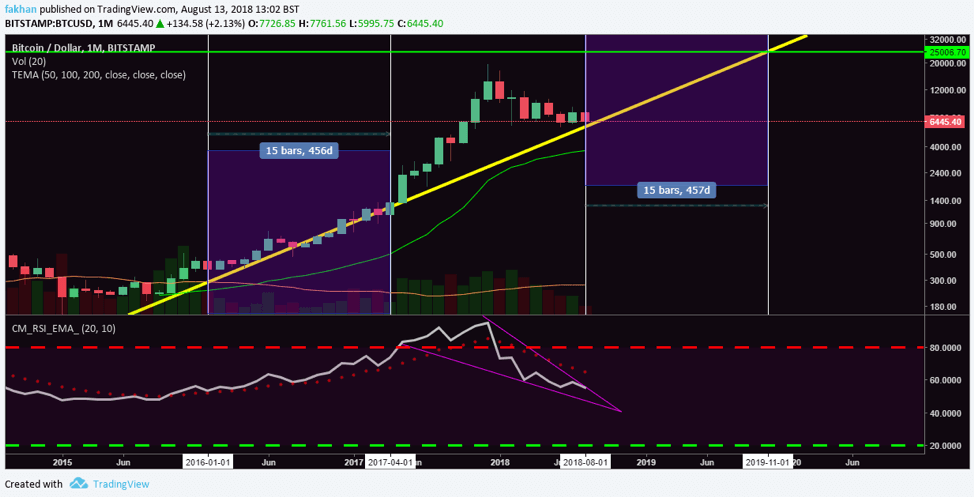
The monthly chart above for BTC/USD shows how Bitcoin (BTC) has traded in periods of falling dominance. Bitcoin (BTC) has continued to climb in periods of low dominance, unlike altcoins which have lost most of their gains as their dominance fell. The chart above shows that Bitcoin (BTC)’s dominance falls before each halvening.
The falling dominance of Bitcoin (BTC) in 2016 led to a sluggish climb that extended over a period of 456 days until Bitcoin (BTC)’s halvening in July 2016 when the price started to rise sharply. The same is likely this time, as Bitcoin (BTC) has once again run into a dominance resistance just before its 2020 halvening. The price can be expected to continue a sluggish climb from here for the next 457 days that is till November 2019, until the halvening in 2020, after which the price can be expected to rise aggressively.
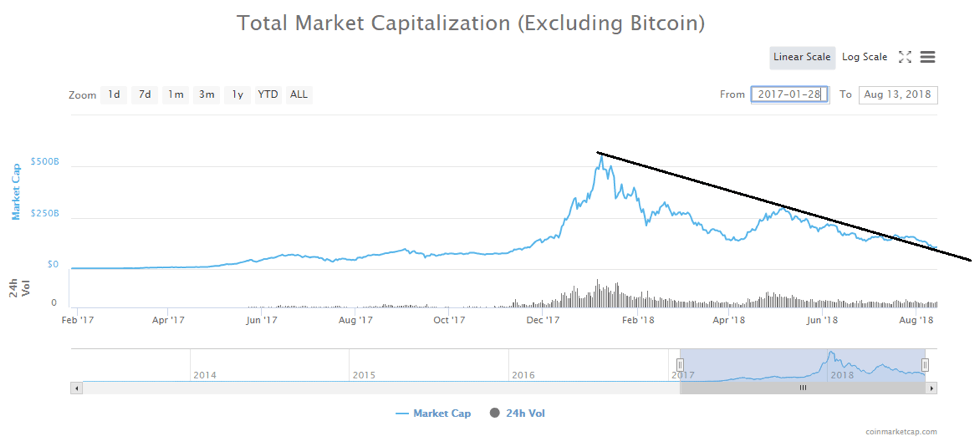
The above chart for altcoins shows that unlike Bitcoin (BTC), altcoins have broken out of the downtrend resistance. The market cap is above the downtrend line and can be expected to bounce off it in order to begin a new cycle in the weeks ahead. The altcoin rally that is likely to kick off before September is expected to last till mid 2019 during which time the altcoin market will reach its peak and most top 20 altcoins can be expected to make astronomical gains.


