


- Bitcoin is seen holding gains of 1.62% in the early part of the week on Monday, but not looking very stable.
- BTC/USD is struggling to break down the $6500-600 area, where a supply zone is seen.
BTC/USD daily chart
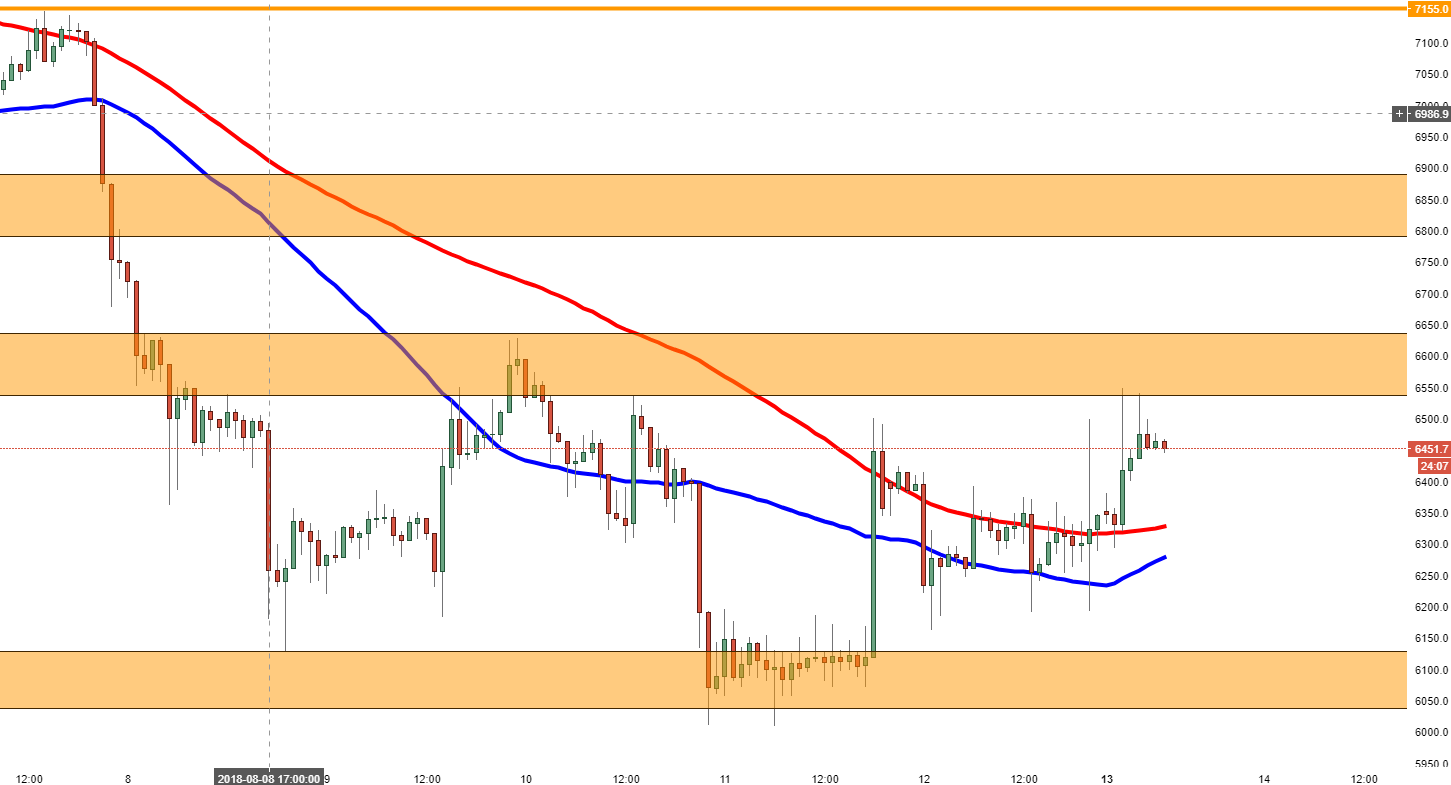
Spot rate: 6448.3
Relative change: +1.63%
High: 6548.3
Low: 6292.7
Trend: Bullish
Resistance 1: 6493.7, (resistance on 60-minute chart).
Resistance 2: 6600.0, supply zone.
Resistance 3: 6624.5, 9th August high.
Support 1: 6330.8, 100MA.
Support 2: 6281.4, 50MA.
Support 3: 6125.0, entrance to demand zone.

