


Ripple (XRP) has been of the most predictable cyptocurrencies in terms of trading. The recent price action is a carbon copy of the price action during its previous cycle. Interestingly enough, Ripple (XRP) seems to have ended the cycle with the same big red candle of capitulation as in the previous cycle. The price has been trading in a falling wedge, same as it did last year. History may not repeat but it does rhyme and what we see on the above chart for XRP/BTC is an absolute testament to that.
RSI levels for XRP/BTC indicate that the price is unlikely to fall significantly at this point. A reversal seems to be less than three weeks away as the price is gearing up for a big breakout. The last time this happened, the price fell below both the 50 EMA and 100 EMA and shot straight up to the 100EMA followed by a rise of three candles directly straight above the 50 EMA all in a span of four weeks. This time, if the price were to reverse, a similar scenario can be expected with the price running to the 100 EMA first, followed by three more aggressive candles, most likely past the previous ATH.
Ripple (XRP) is considered an undervalued coin in itself as the likelihood of 10x or higher gains on this coin is high, but what makes it a subject of debate among crypto enthusiasts is the actual use case of Ripple’s XRP coins. Ripple is a great company with a lot of potential but can the same be said about its coin, XRP? Well, so far the company, Ripple has failed to get any of its partners to effectively use the XRP coin for liquidity sourcing. However, in the future, if they can get banks and large financial institutions to use XRP instead of their nostro accounts, Ripple would be tapping into a trillion dollars forex market and the value of XRP can be expected to skyrocket. So far, nothing of the sort has happened but as long as most cryptocurrencies do not have real use cases, speculation will drive this market and by that account, Ripple (XRP) can be expected to make similar gains as most cryptocurrencies.
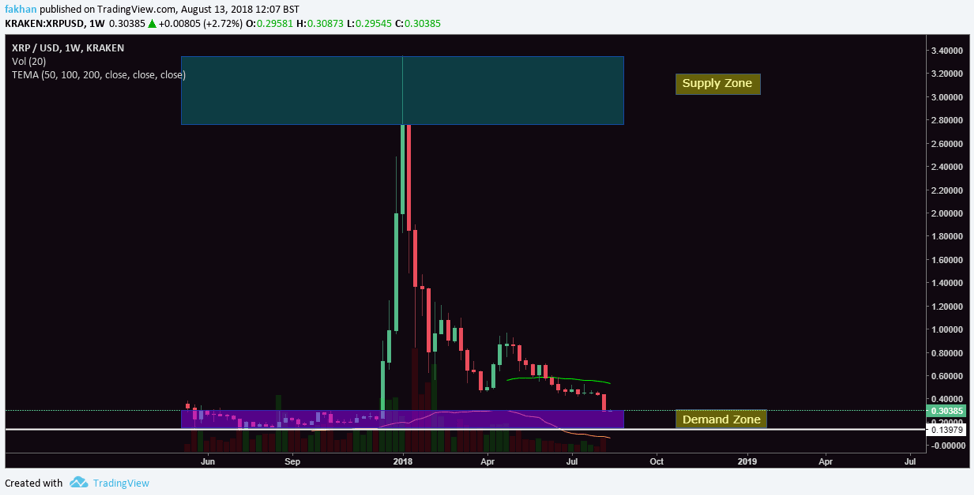
Ripple (XRP) has now fallen down to the demand zone as can be seen on the XRP/USD weekly chart above. The price is back where it was just before Ripple (XRP)’s massively breakout in late 2017. For Ripple (XRP) enthusiasts, this would be the time to start buying for the long term. The price could fall further till the lower limit of the demand zone but the risk/reward at this point makes the trade well worth it.
With the beginning of a new week, Ripple (XRP) is up nearly 3% for the day so far. XRP/USD has formed it first green candle on the weekly chart after two weeks of continuous decline. While further decline is possible, it is not likely as Ripple (XRP) seems to have found a bottom at $0.28.


