


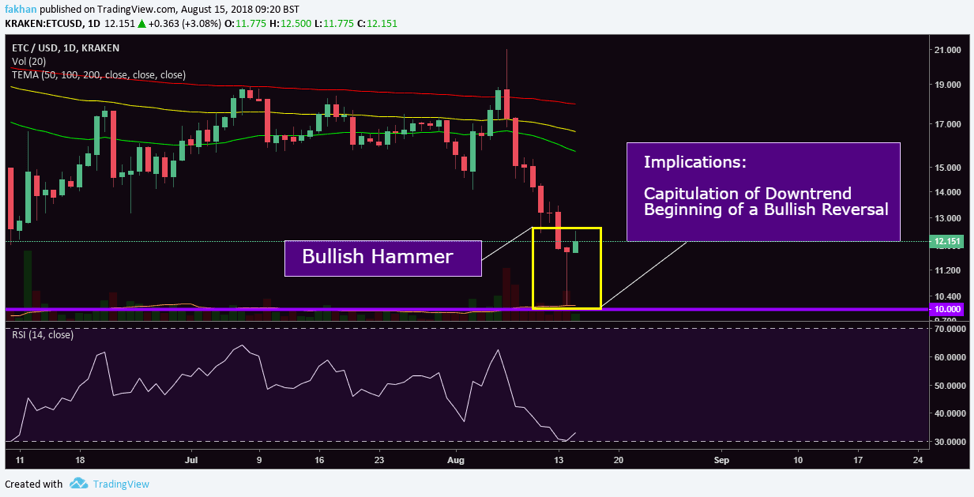
Ethereum Classic (ETC) has just formed a bullish hammer candlestick on the daily ETC/USD chart above, which followed by a green candle is a strong sign of a downtrend capitulation as it indicates that the bears have finally given up. This marks the beginning of a new cycle for Ethereum Classic (ETC) as a reversal is expected from these levels. The solid support of $10 has served as a historical demand zone for Ethereum Classic (ETC), and is a very strong one.
As the chart above demonstrates, Ethereum Classic (ETC) rebounded strongly from the $10 support. The RSI had already reached oversold levels and is currently trading above 30. The price has plenty of room for continuous upside movement which could most likely be accelerated by a Coinbase listing next week. Ethereum Classic (ETC) is already seen as the coin that could trigger the altcoin rally. Positive developments are likely to help it do just that.
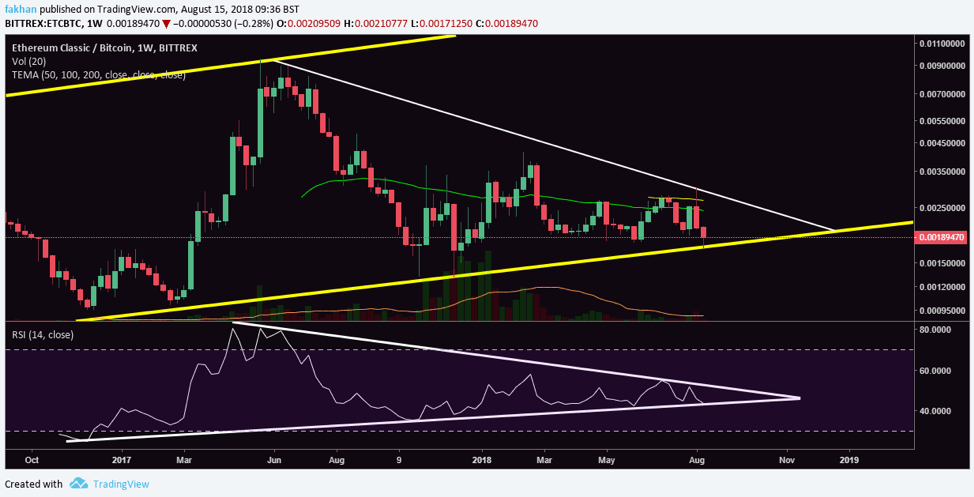
Ethereum Classic (ETC) is still in a downtrend against Bitcoin (BTC) as can be seen on the ETC/BTC weekly chart above. The price has yet to break downtrend resistance against Bitcoin (BTC) but it does seem to have reached rock bottom. The price is currently trading at the lower end of the ascending channel having just bounced off a strong support line. RSI for ETC/BTC is also trading in a wedge and is likely to breakout in the weeks ahead as it trades further along inside it. The EMA alignment for ETC/BTC continues to remain bearish but if the price breaks the downtrend resistance, things might change soon.
Ethereum Classic (ETC) is perhaps the only coin that has held its ground almost as strongly as Bitcoin (BTC) during the recent correction as it has fallen merely 73% since its ATH, compared to Ethereum (ETH)’s 80% fall and Ripple (XRP)’s 92% fall. Ethereum Classic (ETC) is also the best store of value among cryptocurrencies other than Bitcoin (BTC). Ethereum Classic (ETC) being an undervalued project with a lot of potential has made it a safe bet for investors looking who are not comfortable investing in any coin other than Bitcoin (BTC).
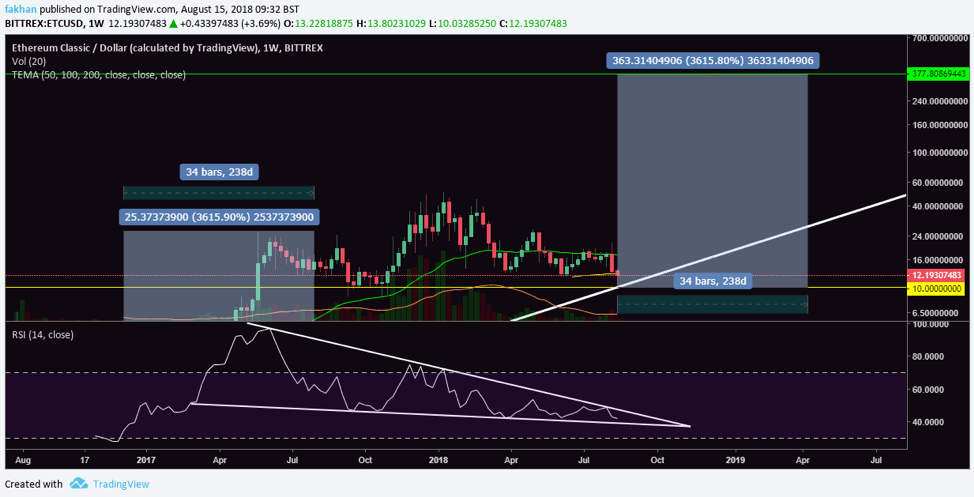
The above weekly chart for ETC/USD shows that the last time Ethereum Classic (ETC) completed a correction; it had a 3615% rally in the next 238 days. Current price action for Ethereum Classic (ETC) shows that its RSI, which is trading in a falling wedge, has to break out in the weeks ahead. The RSI has not been at such critical levels since April 2017. This means that the price of Ethereum Classic (ETC) is now at a turning point where it has to either break to the upside or to the downside.
Considering that Ethereum Classic (ETC) has a lot of positive developments ahead of it and that the price has already bounced off the $10 support with enormous strength, it is plausible to assume that the next break out will be to the upside as Ethereum Classic (ETC) begins a new cycle. The above chart shows that the price is expected to reach an optimistic level of $377 or higher in the next cycle that is expected to last till April 2019.


