


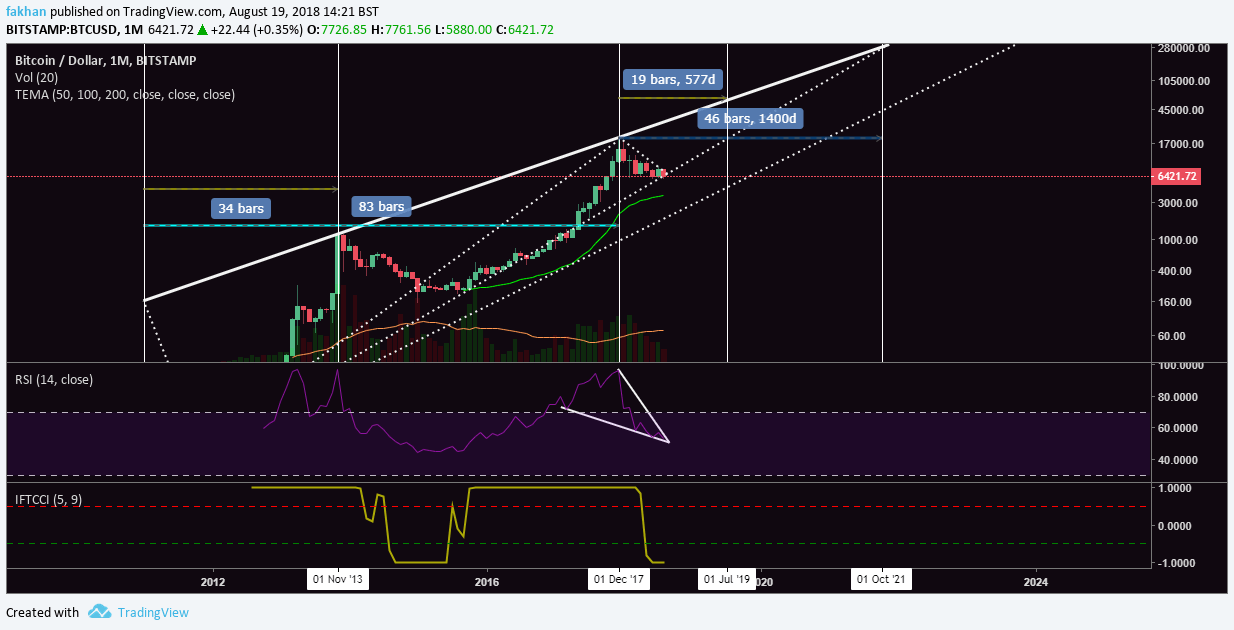
Bitcoin (BTC) has been trading in a series of rising wedges as can be seen on the monthly chart for BTC/USD above. The price reached a target of $1,000 in late 2013 and then began to fall. During that fall, the price broke out of the falling wedge to consolidate before continuing upwards to prepare to enter another falling wedge. From late 2015 to until now, the price has been preparing to enter another falling wedge. Bitcoin (BTC) is just about to enter another falling wedge before the beginning of September this year.
The last time Bitcoin (BTC) entered a falling wedge, it rose for a period of 34 bars out of the total 83 bars of the falling wedge. That is a total movement of 40.96% to reach an ATH before a correction. If Bitcoin (BTC) moves in the upcoming falling wedge for a total of 40.96% before correcting, it will reach a price of $60,000 by July 01, 2019. After which we will experience a correction which will result in breaking the second falling wedge and Bitcoin (BTC) will then have to fall to the lowest dotted line on the above chart.
This means that as time goes by, the aggressive price action will slow down gradually. Bitcoin (BTC) will continue to go up but the rate of change of that growth will become slower with time. This is natural to expect considering as the market cap of Bitcoin (BTC) grows, these big aggressive movements cannot be sustained. It is also pertinent to note here that a Bitcoin ETF is expected in Q1 of 2019. Bitcoin (BTC)’s next big move to $60,000 will benefit from an ETF in early 2019 but the price will correct as the enthusiasm fades away soon afterwards.
Regardless of that, the importance to a Bitcoin (BTC) ETF cannot be underestimated. There was a lot of excitement back then when the CME and CBOE launched Bitcoin Futures. However, many crypto enthusiasts did not realize that these contracts were cash settled and people did not have to buy Bitcoin (BTC) to bet on the price going up, nor did they have to sell. However, if a whale had to make money on the futures contracts they owned, they could just dump some Bitcoin (BTC) on an exchange like Bitfinex to drive the price down. This is why many people have rightly pointed out in the past that Futures served as a pump and dump vehicle for big investors in this space.
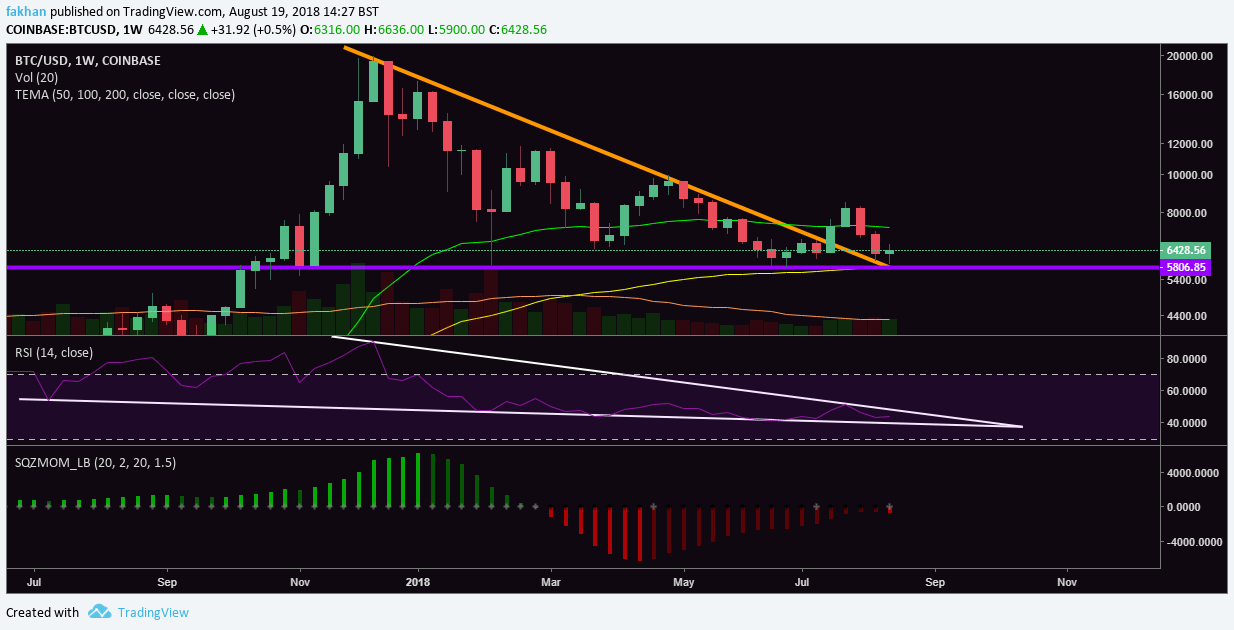
The chart above for BTC/USD on the weekly time frame shows that Bitcoin (BTC) has already broken out of the downtrend and is now all set to begin a new cycle. While there is no shortage of catalysts that could drive the price back to where it fell from, considering we have had nothing but FUD for the last few months, it is important to realize that without an ETF, a price target of $60,000 does not seem likely.
However, if history is any indicator, we have seen that in the past, fundamentals have supported technicals. This means that if the charts show potential for a big move, which they do, news and announcements will most likely support that move. While Futures had a detrimental effect on the price of Bitcoin (BTC) considering they were cash settled, ETF will have the opposite effect as transactions will be physically settled. This means if someone wants to invest in a Bitcoin ETF, they will have to actually buy Bitcoin (BTC) which will decrease the supply in the market , naturally increasing its price.


