


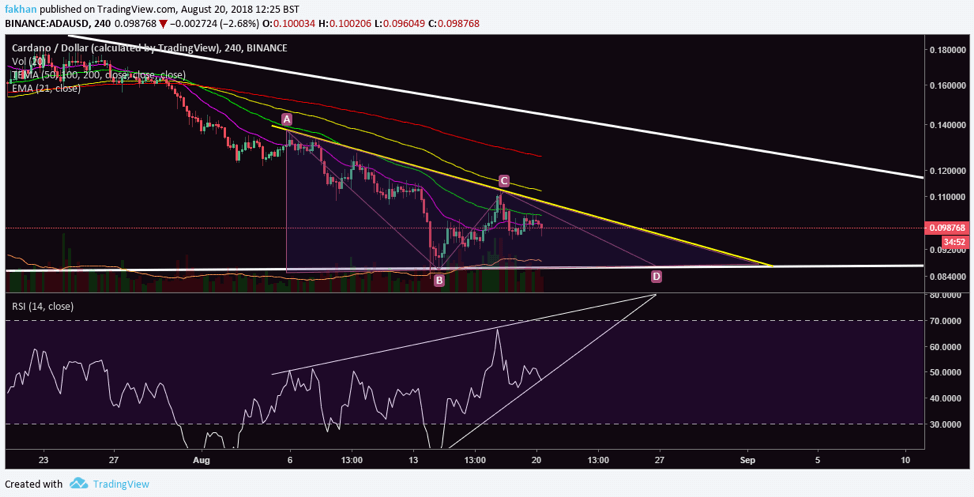
Cardano (ADA) is now down more than 90% since its all time high but that has not stopped it from entering a new bear trend. The price just broke below the 21 EMA on the 4H chart for ADA/USD above. Having already broken below the 50 EMA, Cardano (ADA) was expected to find support at the 21 EMA but the price failed to hold its ground and broke below it. Furthermore, the 21 EMA has now become a strong resistance for Cardano (ADA) which means the RSI is likely to break out of the falling wedge at this point.
If the RSI breaks out of the falling wedge at this point, it would give a green light to the bears to take the price further down. The price of Cardano (ADA) entered a triangle on August 6, the upper limit of which has served as additional temporary resistance. The price has now been rejected twice by this additional resistance and will have to fall again to test the lower limit of the triangle before any hope of breaking out of it. RSI for Cardano (ADA) has not been this vulnerable in a long time. The price has been in a constant downtrend since the beginning of the month and has shown no signs of any recovery.
Cardano (ADA) has been struggling to break past $0.11 for the last few days but a series of temporary resistances have made that quite challenging. If the price tries to escape the downtrend at this point, it will first have to break past the 21 EMA, then break above the 50 EMA and just when it tries to break past the downtrend resistance of the triangle, it will run into the 200 EMA which makes it very hard for Cardano (ADA) to break out of its downtrend at this point. The bears, realizing this, are more confident than ever as the bearish setup is a favorable one with a relatively lower risk/reward at this point. The lack of volume makes it easier to push the price down as the sentiment is already negative.
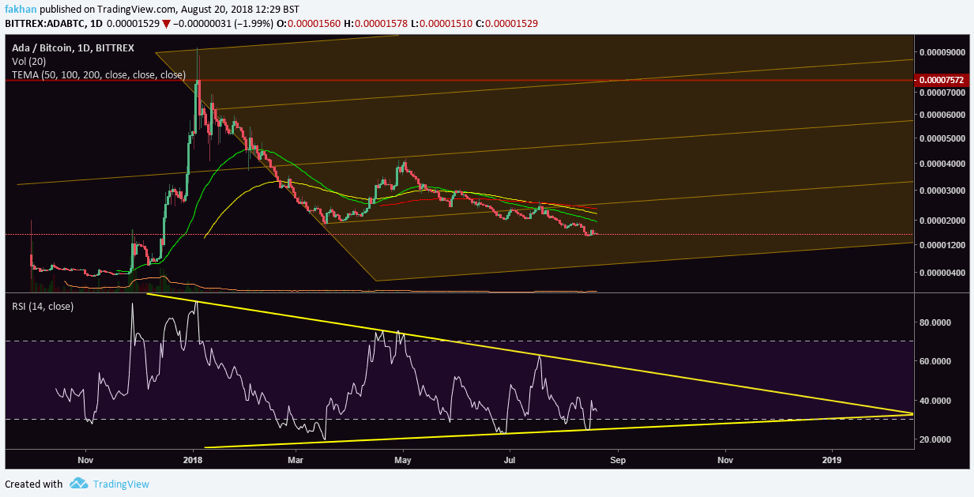
The above daily chart for ADA/BTC shows that the price of Cardano (ADA) has yet to complete a correction against Bitcoin (BTC). Since the beginning of this month, the price has fallen down to the lowest portion of the pitchfork on the above chart. If the price fall sharply, the correction could reach completion this month or the next, otherwise it will have to extend till the end of the year. It is pertinent to note that the EMA alignment for Cardano (ADA) has just turned completely bearish and the price now risks falling further significantly from these levels.
RSI analysis for the above chart shows that the price is in a strong downtrend and the RSI is trading inside a wedge, but still has a lot of room to go before a breakout. RSI analysis for ADA/BTC further corroborates the view that the correction might extend all the way to the end of the year.


