


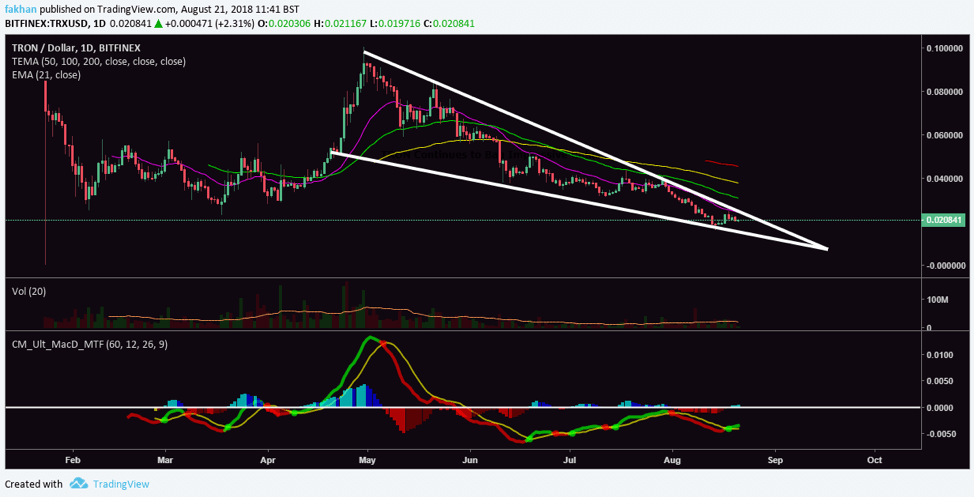
Tron (TRX) rose to prominence in 2017 with its astronomical gains. The cryptocurrency is known for aggressive movements as can be seen on the above daily chart for TRX/USD. The price of Tron (TRX) has been trading in a giant falling wedge since the beginning of its correction. Unlike most cryptocurrencies, Tron (TRX) had one big rally between April and May even during a bear market. The price then entered a long term correction which seems to have come to an end now.
The above chart shows that Tron (TRX) is all set to break out of this falling wedge anytime before October. The most likely scenario is that this breakout will take place in early September. EMA alignment for Tron (TRX) continues to remain bearish as the price has now fallen below the 21 EMA as well. However, the MACD profile shows that Tron (TRX) is gearing up to breakout in the weeks ahead. As the chart shows, Tron (TRX) has reached the full extent of its movement within the falling wedge and will soon have to break above it to begin a new cycle.
The price of Tron (TRX) is currently trading just above 2 cents and can easily rise to 10 cents during the first few weeks of the new cycle. Tron (TRX) is a smart contracts platform that was once an Ethereum (ETH) ICO but now has become its competitor. The market valuation of Tron (TRX) is still nowhere close to Ethereum (ETH) but most analysts still think that Tron (TRX) has profited off a lot of hype and speculation while there is nothing much on ground to justify its current valuation relative to other similar projects like Cardano (ADA) and Ethereum Classic (ETC).
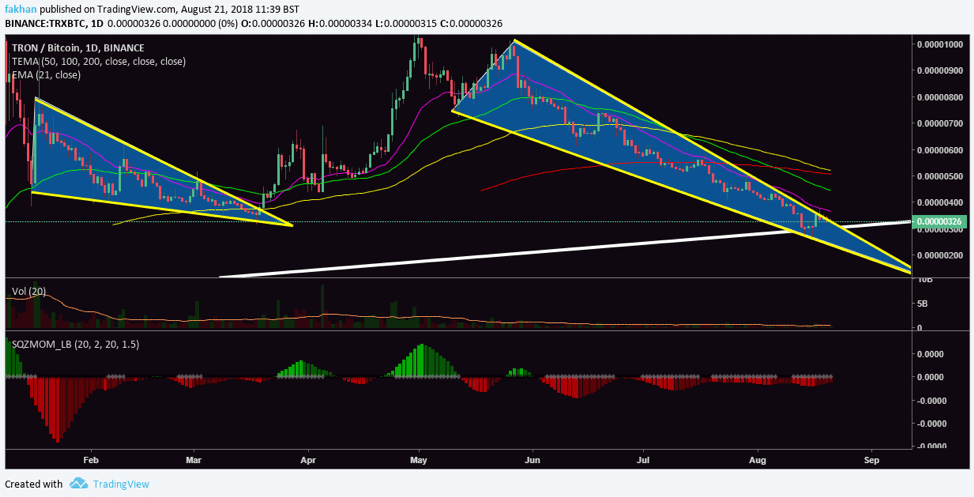
It is not yet clear whether Tron (TRX) will succeed in giving Ethereum (ETH) a run for its money, but the charts do indicate that Tron (TRX) is poised for a big breakout. The above daily chart for TRX/BTC shows that the price of Tron (TRX) has been trading in a falling wedge against Bitcoin (BTC) since the beginning of June, after Tron (TRX) formed a double top against Bitcoin (BTC). The Squeeze momentum profile on the above chart shows that the price is ready for a bullish breakout in the days ahead. If the price does not break out of the falling wedge at this point, it will have to test the lower limit of this wedge again before another attempt at a breakout.
EMA alignment for TRX/BTC is starting to turn bullish with the 100 EMA already above the 200 EMA and 50 EMA preparing to break above the 100 EMA after it breaks past the 21 EMA resistance. Volume for TRX/BTC has been shrinking the past few weeks and has now reached unprecedented levels. The last time TRX/BTC was in a falling wedge, it broke out before reaching the end of that wedge and began a new cycle. If history is any indication, Tron (TRX) can be expected to break out of this falling wedge before mid September to start a new cycle.


