


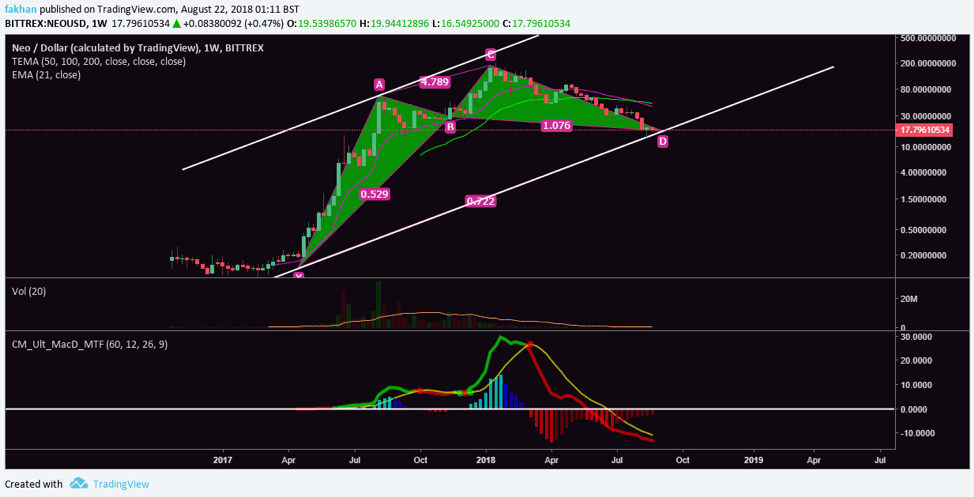
NEO (NEO) has just completed the full extent of its correction as can be seen on the NEO/USD weekly chart above. The price is currently at the lower end of the ascending channel and has completed a big bullish cypher. The bullish cypher on the above chart was completed between April 2017 and August 2018. That is a big sigh of relief for a coin that is now down 91% from its all time high. MACD profile for the NEO/USD chart above also seems to have run its course and is now preparing for a trend reversal as the gap between the red and yellow line narrows. NEO (NEO) also seems to have now completed its capitulation phase which began when the 21 EMA broke below the 50 EMA.
NEO (NEO), often hailed as the Chinese Ethereum (ETH) is definitely a great project with a lot of future potential, but it is yet to see the same level of recognition and adoption as its rival, Ethereum (ETH). The current market cap of NEO (NEO) is $1.1 billion compared to 28.4 billion for Ethereum (ETH). That is a market cap difference of 25 times! However, this difference does not look as unreasonable when you consider that NEO (NEO) has not delivered much on its promise of Chinese adoption.
The sole reason NEO (NEO) rose to such prominence last year was because in addition to being a promising project, NEO (NEO) was set to dominate the Chinese market. China has a total population of more than 1.37 billion which looks like a big opportunity to most blockchain projects. However, doing business in China especially for crypto related companies is no easy feat. This is why NEO (NEO) being a Chinese company, operating from China, with a sound understanding of the Chinese market and culture became the best bet for investors looking to capitalize on the Chinese crypto adoption.
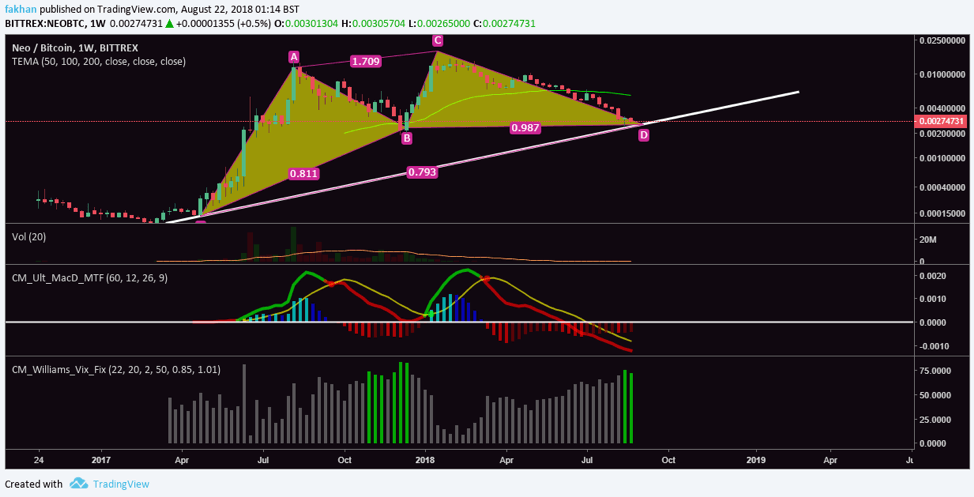
NEO (NEO)’s movement against the US Dollar (USD) and Bitcoin (BTC) mimic one another, with slight differences. The above weekly chart for NEO/BTC shows the same bullish cypher as the NEO/USD chart. MACD profile for NEO/BTC also looks the same with the same bridging gap between the red and yellow lines. Additionally, the VIX profile for NEO/BTC shows that the bottom is in and a new trend is likely to begin from here. The last time we saw two consecutive green bars on a weekly VIX profile for NEO/BTC was back in late 2017, just before a big rally. If a similar profile is to form again, then NEO (NEO) might have to consolidate for a few weeks before the next move up.
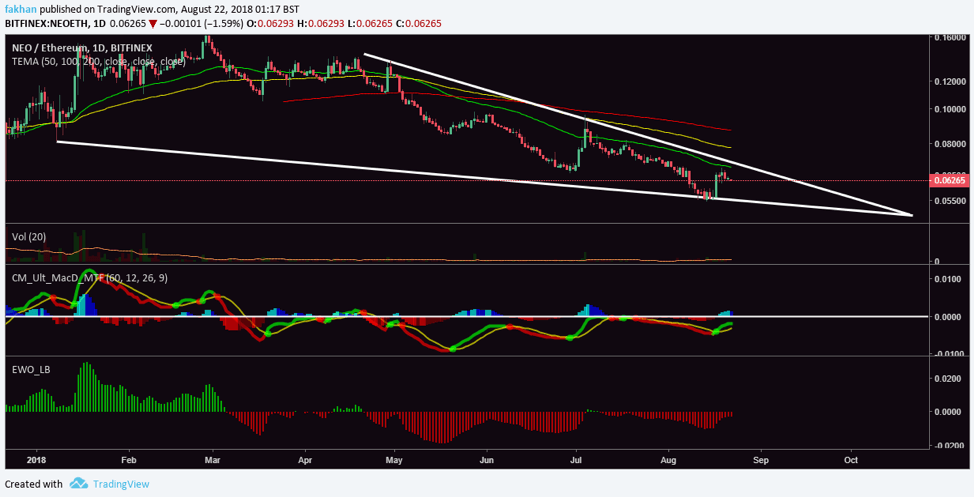
NEO (NEO) is still trading in a big falling wedge against Ethereum (ETH). The above daily chart for NEO/ETH shows that NEO (NE) is in a strong downtrend against Ethereum (ETH) but it is also closer to the end of the falling wedge it has been trading in since the beginning of the year. Elliot Wave Oscillator for the above chart shows that the NEO/ETH has lost its bearish momentum and the trend might soon reverse with NEO (NEO) gaining the upper hand on Ethereum (ETH) as far as future gains are concerned.

