


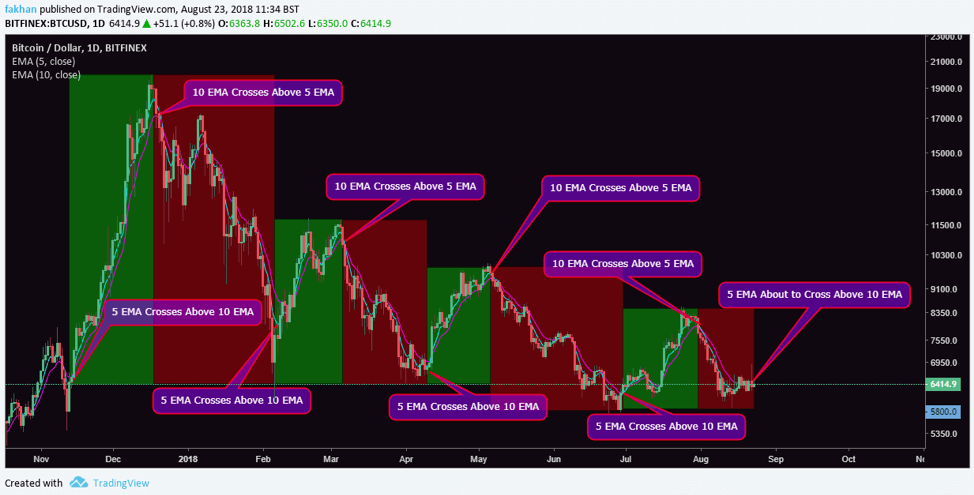
Bitcoin (BTC) is down 68% from its all time high of $19,665 which looks bad for those who had been holding since then. However, for those who have been trading, even just the monthly plays could have easily made a 626% return on their investment with the help of two simple indicators. Those indicators are the 5 EMA and 10 EMA as can be seen on the daily chart for BTC/USD above. These indicators have been signaling the direction of every bullish and bearish wave throughout the correction period.
The first time the daily 5 EMA crossed above the 10 EMA was before a massive bull run back in November 2017. This was a very aggressive bullish wave towards Bitcoin (BTC)’s all time high. However, soon as that ATH was reached, the 10 EMA crossed over the 5 EMA, a bearish sign which gave us a fair warning that things are about to go south. There might have been traders who did not take this sign because they were more interested in 1H or 4H plays. However, in markets like these, such plays could be extremely risky in the absence of proper regulation and transparency.
While it may be easy to manipulate the price action of Bitcoin (BTC) on a smaller time frame, it becomes incredibly hard to manipulate the price on a monthly time frame. This is why the chart above shows all the monthly plays that an investor could have made to make that 626% return on investment. As the chart shows, the price action has followed an alternating sequence of bullish and bearish crossovers between the 5 and 10 EMAs. There have been a total of 4 waves up and four waves down so far. It also means that the next wave from here on out will be a bullish one and could start soon as the EMA alignment on the above chart shows.
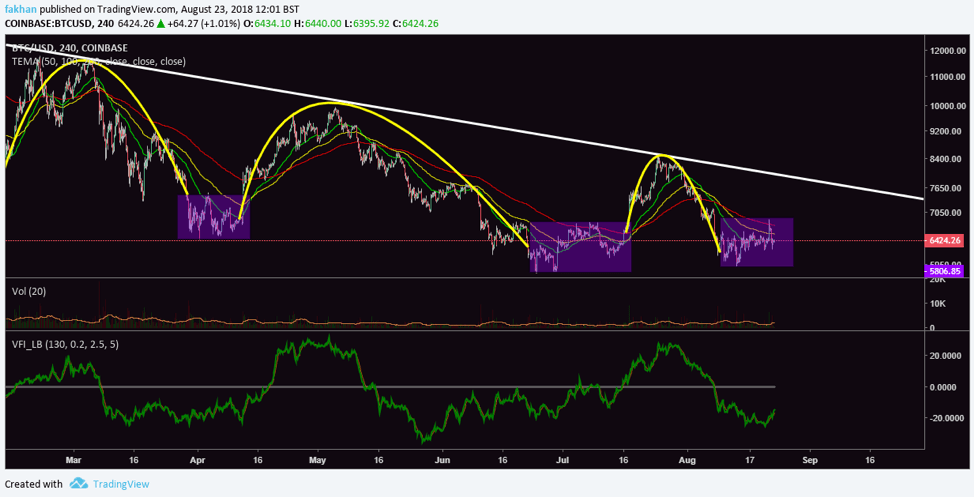
The 4H chart above for BTC/USD that shows the movement of Bitcoin (BTC) on a smaller time frame shows that Bitcoin (BTC) trading has been dominated for the most part by bots that have followed a series of similar patterns. The volume flow indicator on the above chart shows that the time for consolidation is almost over and Bitcoin (BTC) will have to make a move in the days ahead. Based on previous patterns, that move will most likely be to the upside till Bitcoin (BTC) runs into a short term resistance. After that, it will be up to Bitcoin (BTC) whether it can break the downtrend this time or will it have another wave down before any bullish moves.
Seeing as how Bitcoin (BTC) suffered serious losses in the past 24 hours after the ProShares ETF rejection, it seems unlikely that Bitcoin (BTC) has the strength to break the downtrend at this time. We will likely see a rise up to the downtrend resistance, but the price will fall lower again after rejection at the resistance. Volume for BTC/USD has been on a constant decline and there is no sign of any institutional money getting into the market at this point.
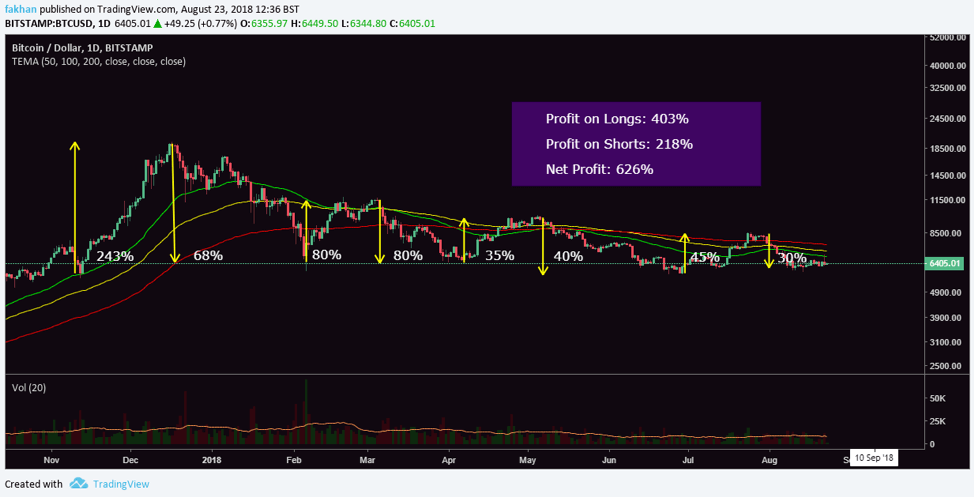
The above daily chart for BTC/USD sums up how exactly those gains could have been made. Overall, there would have been four trades up and four trades down. The total profit for the four buy positions on Bitcoin (BTC) would have been 403% and the total profit for the four sell positions on Bitcoin (BTC) would be 218%. This means that investors who did not want to expose themselves to unnecessary risks could still have made a total of 626% return on investment without any specialized knowledge of trading or risk management, but just riding these big monthly waves up and down using just these two EMA indicators.


