


Post its bull run and its subsequent negation the Bitcoin price is now back to its interim consolidation sentiment.
The BTC/USD yesterday formed higher highs towards 6900-fiat, only to find itself erasing the superb rally and falling back to create an intraday low near 6260-fiat.
The pair, ever since, has bounced back weakly towards the 6500-6510 area, bringing sentiment into the same consolidating range it successfully escaped yesterday. It looks like only a few whales with big hidden buy walls are keeping us away from the bottom near 5864-fiat. If we go above from here, we will establish 6200-area as our newly found bottom, and open attractive long positions. But before dwelling into our intraday positions, let’s check out what the market sentiment is all about this Thursday.
BTCUSD Technical Analysis
We are currently inside a Rising Wedge of the height of around $700. Traditionally, a rising wedge is an indicator for traders to exit long positions if the price is near the lower trendline. A breakout here at any point of time could mean price running down into the direction of its breakout, generally until the height of the wedge is established. That said, medium-term traders should be placing their stop losses below the lower trendline if they are playing a long position. Similarly, stop losses above the upper trendline while playing a pullback is recommended as a fellow trader.
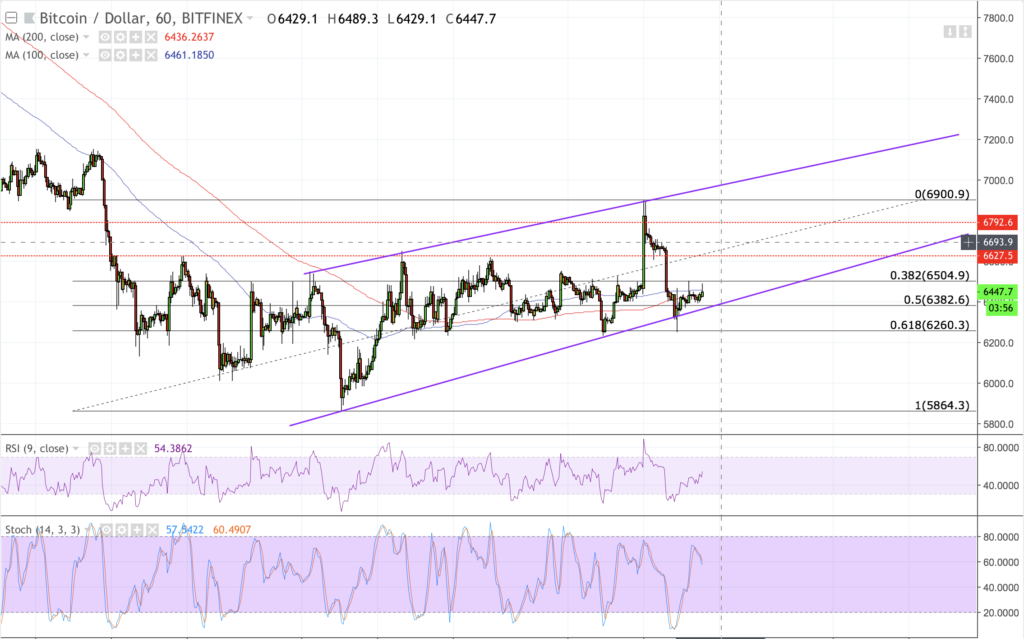
Sentiment-wise, the BTC/USD pair is now marginally below its 100 and 200H SMA, indicating an interim selling sentiment. The RSI and Stochastic, on the other hand, have recovered from their oversold areas and are inside a neutral range, expecting a further correction.
Overall, we are looking at a near-term bias conflict, with expectations of an extended upside recovery towards 6620-fiat, to begin with.
BTC/USD Intraday Analysis
After establishing a fresh intraday high around 6900-fiat, we have drawn our Fibonacci retracement graph on a swing from 5864-low to 6900-high, which has given us potential intraday levels to enter/exit our positions. So far, the Fib levels are proving to be accurate, and hence, the range we are watching for today is defined by 6500-6504 area as interim resistance and 6382-6400 area as interim support.
We are beginning with our breakout perspective. We will be waiting for BTC/USD to break above 6500-fiat; it will allow us to enter a long position towards 6620, our primary upside target. At the same time, our stop loss will be three-pips below the entry position to define our risk.
In case the BTC/USD pair pullbacks from resistance, we will first wait for the pair to test lower trendline of the rising wedge. If it’s broken, even with a hint of recovery, then we will enter a short position towards 6260, our previous low while placing our stop loss around 4-5 pips above the entry position.
Trade safe!
Featured image from Shutterstock. Charts from TradingView.
Follow us on Telegram or subscribe to our newsletter here.
• Join CCN’s crypto community for $9.99 per month, click here.
• Want exclusive analysis and crypto insights from Hacked.com? Click here.
• Open Positions at CCN: Full Time and Part Time Journalists Wanted.
