


Despite the depressed sentiment that we see around us nowadays it is clear that Bitcoin’s long term chart is bullish. We believe Bitcoin is not in a bear market currently, on the contrary. Our article will cover the main reasons we believe another leg up is in store for Bitcoin price in 2018 to 2019. This is another piece in our series of 2019 forecasts.
As per InvestingHaven’s methodology we apply the ‘start with chart’ principle. Let’s first understand what we can derive from Bitcoin’s long term chart.
Bitcoin’s Long Term Chart is Bullish
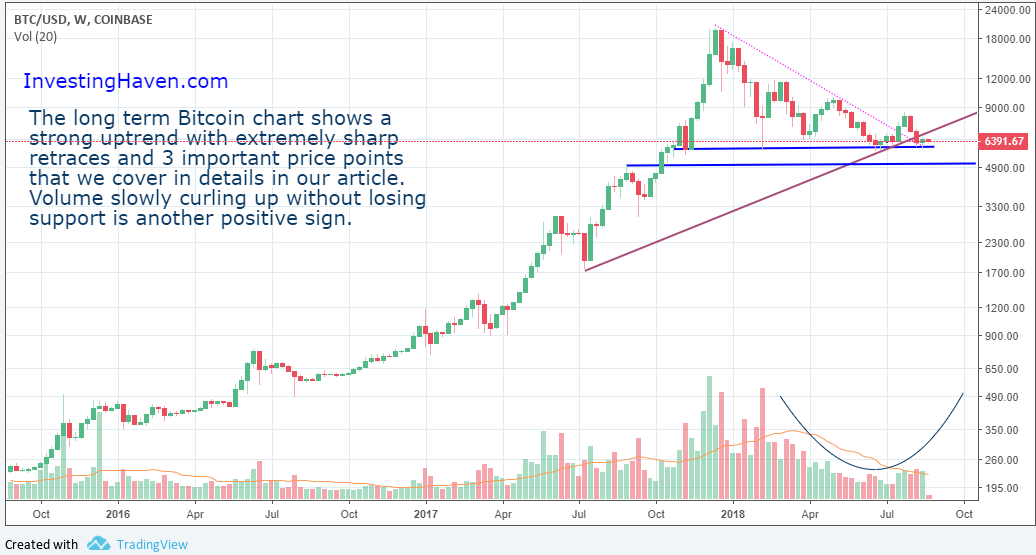
From the long term Bitcoin price chart above, we derive the following observations:
The long term Bitcoin chart shows 3 important price points investors need to keep in mind:
- The $6000 mega support level got tested successfully multiple times in 2018. Each time it held strongly.
- The $7000 short term resistance will cross the purple trend line, see Bitcoin’s long term chart above. We expect the trend line to act as a resistance but if the price breaks upwards it will accelerate the bullish price movement. If Bitcoin’s price gets rejected at $7000, then we might see a continuation of the sideways movement in Bitcoin price.
- The $5000 ultimate support is an important price point because it was the top from the previous leg up.
We note as well how the volume is slowly returning into Bitcoin (1) as other altcoins are crashing or simply disappearing (2) As Bitcoin dominance is increasing and showing how it remains not only the sector leader but also a safe haven within the Cryptocurrency market.
As more altcoins die, we expect Bitcoin’s dominance to increase further. This is something we have warned our readers about. 75% or more altcoins will die and it’s important to select the few that are likely to survive an thrive. Find our selection in our Cryptocurrency and Blockchain research section here.
Bitcoin Price has been following the same pattern since inception
Bitcoin has been making a similar pattern of parabolic advances, followed by sharp retraces to give up up to 90% and even 100% of the latest gains before advancing again to new highs.
We tried to show the main tops and how the price revisits those tops in the chart below. You can also note a similar pattern on less significant tops if you you zoom in. To keep our article focused, we will only look at the major tops in the chart below.
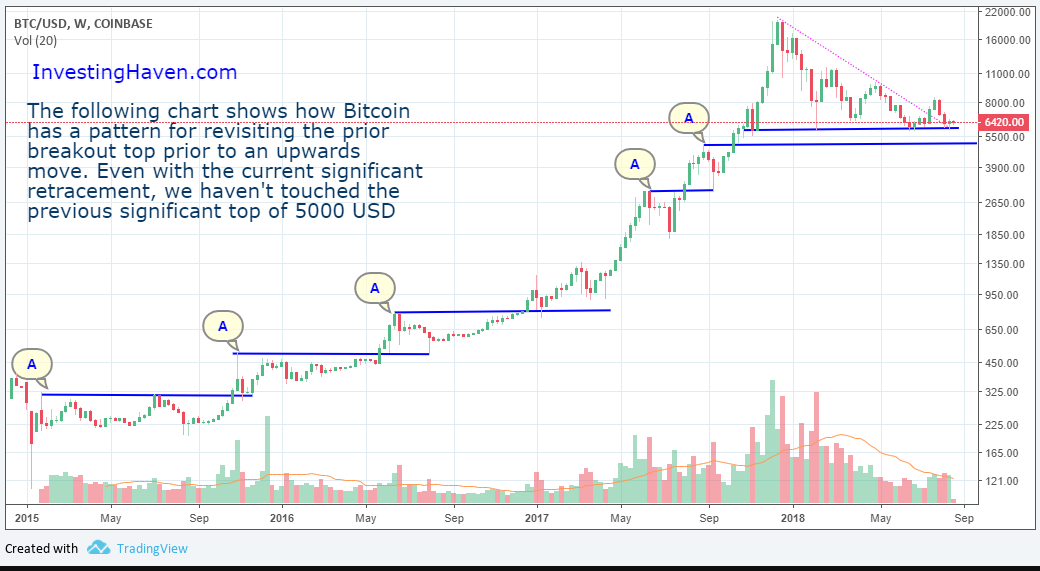
The chart shows clearly how Bitcoin’s price almost always revisits the previous top with the exception of a couple instances where the momentum was so high Bitcoin was bought back before any retest.
Note also how the recent price retrace didn’t even touch 5000 USD which is technically the most notable previous top. In fact, Bitcoin gets bought back at 6 instead of 5 k which shows that buyers are still on the sidelines and off setting the sell offs that we see with every Bitcoin price pop. Eventually, sellers get exhausted and the money on the sidelines initiates full positions pushing the price higher.
Conclusion
Our conclusion is Bitcoin is still in a Bull market provided it trades above 5k. As we can see in the chart, bulls couldn’t push the price above 8500 during the last pop but bears couldn’t push the price below the 6k support area either, which in itself is constructive.
Hence we base our price perspective on the dominant long term trend which is a strong upwards trend with lots of volatility, sharp retraces but Bullish nonetheless.
Want to know more about investing in Bitcoin, altcoins or blockchain stocks? We have identified the 10 most valuable cryptocurrencies and 10 best blockchain stocks, become a member NOW >>
Crypto market BREAKOUT: InvestingHaven flashed a BUY alert on July 18th 2018. Top notch guidance on how to play this breakout, tips on establishing a future proof crypto portfolio, our selection of 10 top cryptocurrencies and blockchain stocks. Go to our Blockchain Investing Service >>

