


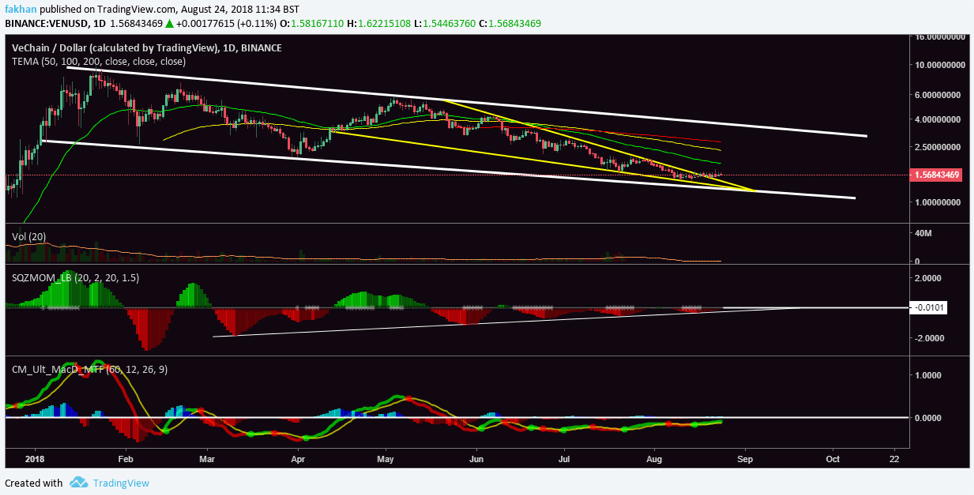
VeChain (VEN) has just broken out of a falling wedge against the US Dollar as can be seen on the VEN/USD daily chat above. The price has yet to test the bottom of the descending channel it has been trading in since the beginning of the year. However, technical indicators at this point indicate a rally from these levels towards the top of the descending channel. Squeeze momentum indicator on the above chart shows a declining bearish momentum since March. As of now, the bears no longer seem to be in control as the price has broken out of a falling wedge resistance.
VeChain (VEN) volume has been dwindling constantly for the past few months and has now reached critical levels, where a reversal can be expected. However, long term bullish outlook still depends on Bitcoin (BTC) and the overall market conditions. Short term, the price is likely to rally from this point but will find resistance at the 50 EMA. The overall EMA alignment continues to remain strongly bearish as the gap between EMAs widen in a bearish order. MACD conditions also support a rally at this point.
VeChain (VEN) has had one of the most brutal corrections among all cryptocurrencies. The price is currently down 99.4% since its all time high of $8.46. For early investors in VeChain (VEN), the ROI is still a whopping 1500% since VeChain (VEN)’s launch. Trading volume for VeChain (VEN) is primarily dominated by Binance. There is still plenty to be done on the technical side as VeChain (VEN) does not have any significant Github activity compared to other promising projects. However, the problem that VeChain (VEN) set out to resolve is a serious one. VeChain (VEN) serves the BaaS (Blockchain as a Service) industry and aims to address issues like supply chain tracking, theft protection, anit-tampering etc.
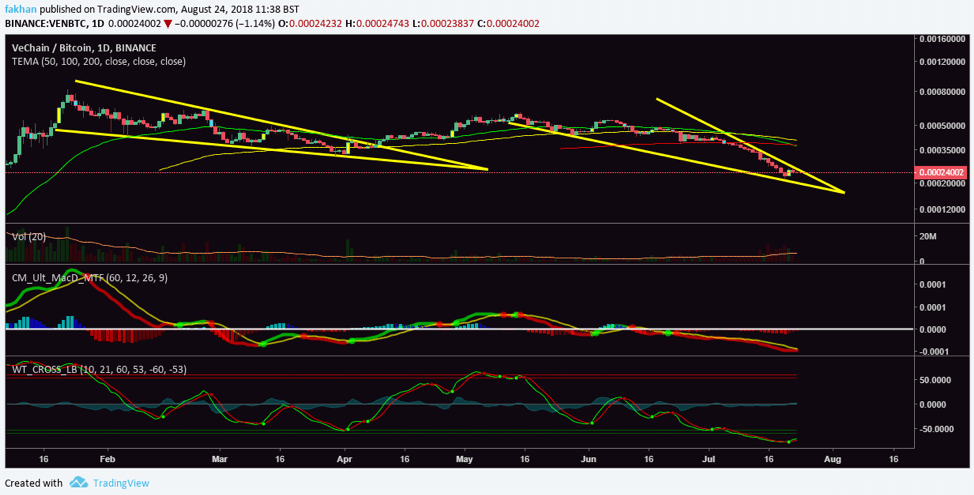
VeChain (VEN) has broken a critical resistance against USD on the daily timeframe but it has yet to break a critical resistance against Bitcoin (BTC). The daily chart above for VEN/BTC shows the price trading in a falling wedge. VeChain (VEN) entered a first falling wedge earlier this year in January against Bitcoin (BTC). The price continued to decline till April as the rest of the market tumbled. However, in April the price began to rally against Bitcoin (BTC) but was soon pushed back into a correction as the price entered another falling wedge in May.
VeChain (VEN) has almost reached the full extent of its movement against Bitcoin (BTC) in a falling wedge. The price could complete one wave down but it will soon have to break out. MACD analysis shows that the price has been preparing for a reversal as the gap between the red and yellow lines has bridged the last few days. Wave Trend analysis for the above chart gives an even stronger indication that the price is at the point of a big reversal and is likely to rally in the days ahead.


