


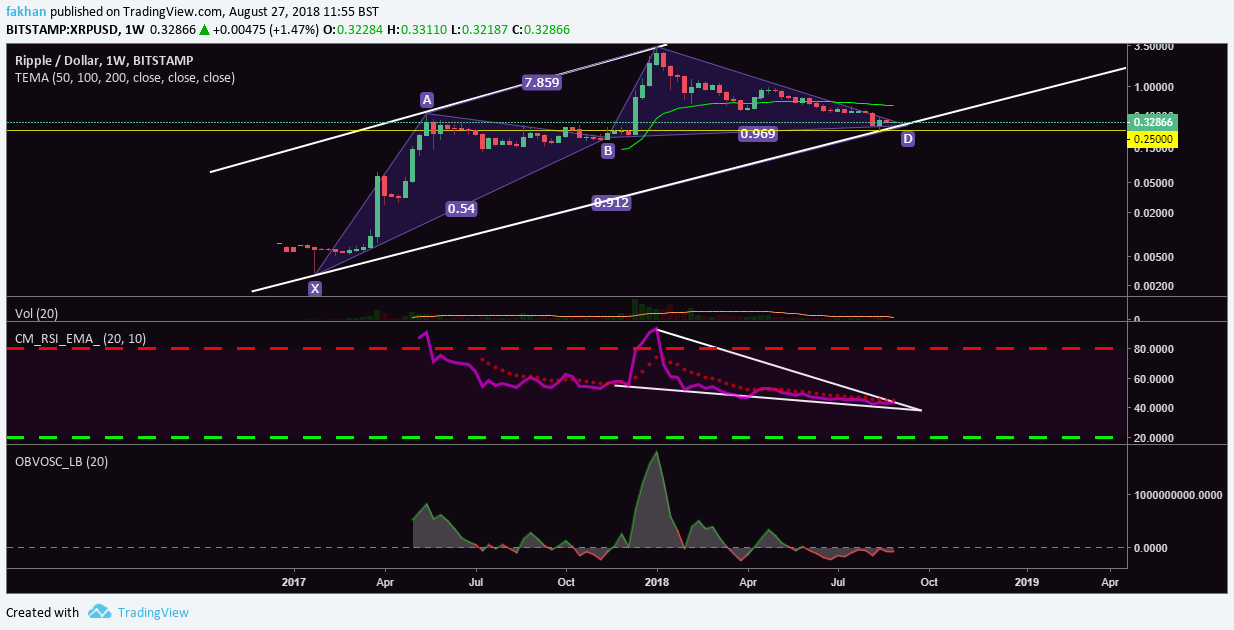
Chart for XRP/USD (1W)
Ripple (XRP) has had an extraordinary correction. Most investors not familiar with Ripple (XRP) would find it hard to believe that the third largest coin by market cap fell from $3.2 to current levels. This extensive correction is an indication that Ripple (XRP) attracted a lot of quick buck artists. However, recently many investors have come to value Ripple (XRP) as a long term investment as they believe it will eventually dominate the trillion dollars forex market.
How, when or if that will ever happen is not yet clear but one thing is clear that Ripple (XRP) has bottomed out for now and is now ready to begin a new cycle. The price of Ripple (XRP) has been trading in a giant bullish garter pattern that extends all the way to 2017. This means that Ripple (XRP) had two big rallies in a period of almost two years. The majority of Ripple (XRP)’s trading period is spent in the red. The green days are fewer but stronger. This is also the reason why there are so many Ripple (XRP) hodlers. The price of Ripple (XRP) may rise in a matter of weeks and then stay down for the rest of the year and you might miss out on all your gains for the year. This mindset has created plenty of hodlers in the crypto community but when it comes to Ripple (XRP), the number of hodlers is the highest among all investors.
RSI for Ripple (XRP) has reached the limit of its movement within a falling wedge and is now ready for an aggressive breakout that could mark the beginning of a new rally for Ripple (XRP). Previously, Ripple (XRP) capitalized on news of partnerships with many large financial institutions to cross the $3 mark. What Ripple (XRP) might do this time to reach that mark or even top it yet remains to be seen, but the company does seem to be in a stronger position as it has dealt with most of its legal problems and this time appears to be more serious towards the actual use of its XRP tokens.
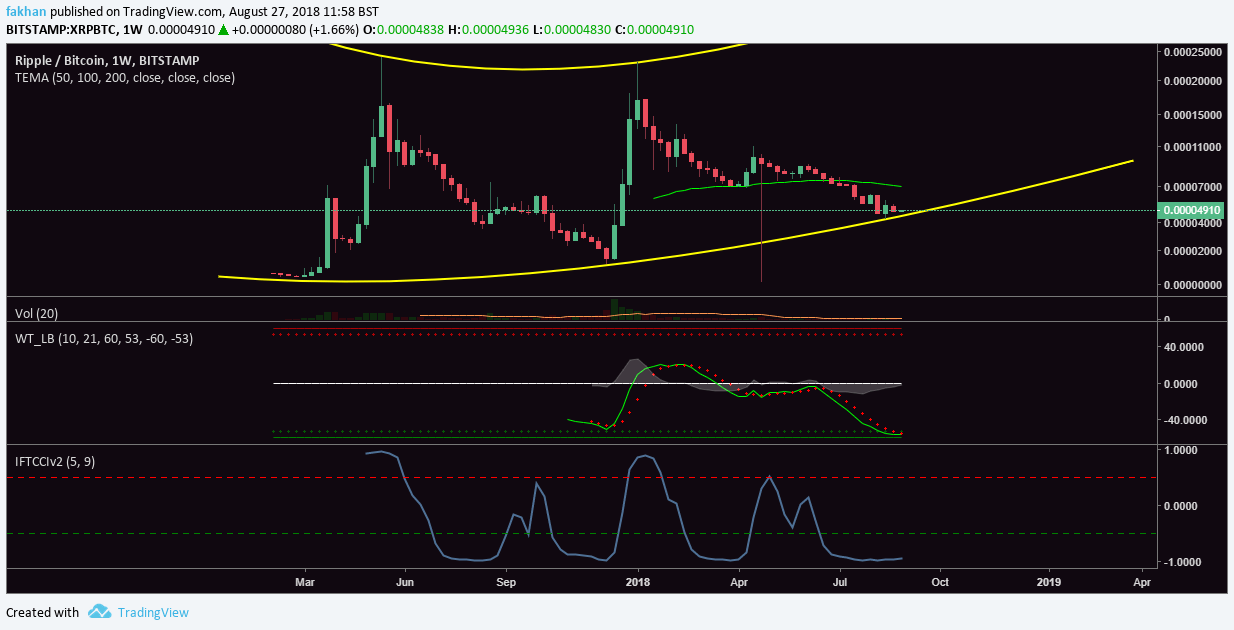
Chart for XRP/BTC (1W)
The above weekly chart for XRP/BTC shows how Ripple (XRP) has printed the exact same pattern as before. Wave trend analysis for the above chart shows that Ripple (XRP) is about to begin a new cycle. The first candle for the new cycle could be formed as early as this week. IFTCC indicator on the above chart shows how Ripple (XRP)’s price has completely bottomed out.
Ripple (XRP) is currently up against Bitcoin (BTC) which is a strong sign that a trend reversal is around the corner and an altcoin rally is about to start. The first candle for XRP/BTC might find resistance at the immediate 50 EMA resistance but long term prospects are brighter than ever and it would not be surprising at all to see Ripple (XRP) reach a new all time high by July next year.


