


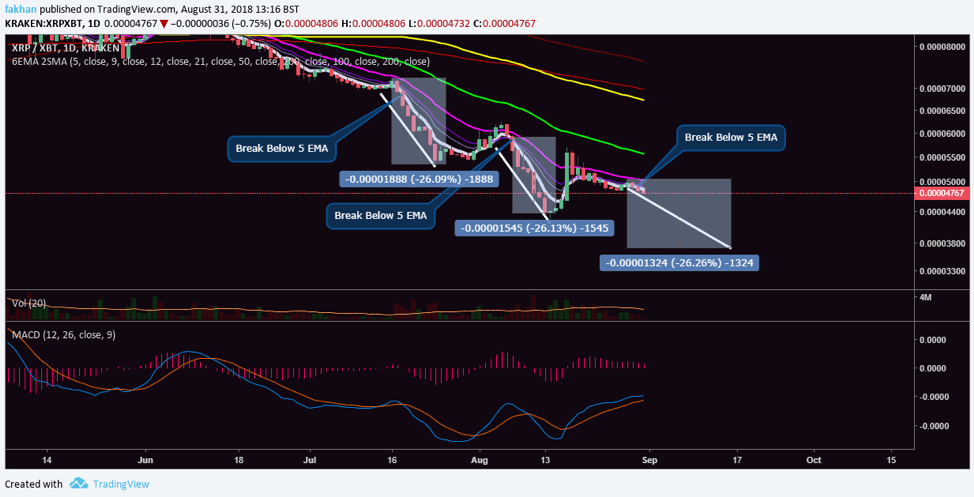
Ripple (XRP) is not at a good point, for now. The price has once again broken below the 5 EMA and is now likely to fall further. The 4H chart above for XRP/XBT shows that during the past few months, every time the price of Ripple (XRP) has fallen below the 5 EMA, it was followed by a 26% correction. The first time this happened was in July when one red candle that closed below the 5 EMA on the 4H timeframe was followed by a series of red candles till the price had a 26% correction. The second time this happened was in early August when the price fell simultaneously through the 21 and 5 EMA which was followed by a long queue of red candles with no green candle in between.
This time, the price has fallen again below the 5 EMA and we have already formed three red candles. There is no reason to believe that a 26% correction will not follow through at this point same as before, not when all the technical indicators are indicating a fall. MACD profile on the above chart also shows that the blue line is likely to cross below the red line which will trigger another bear run. This might just be the last wave down Ripple (XRP) needs to complete against Bitcoin (BTC) before a trend reversal. The price has already completed a correction of more than 90% and is not likely to fall more than 30% from current levels in the days to come.
The above chart further shows that the gap between the 21 EMA and 50 EMA has been bridging which means things are getting better long term but short term, the gap between 21 EMA and 5 EMA is deepening which is another strong signal that the price might fall further from these levels in order to fully complete its correction against Bitcoin (BTC). Volume has been increasing over the last few weeks as the chart shows but most exchange activity is still dominated by bots and traders.
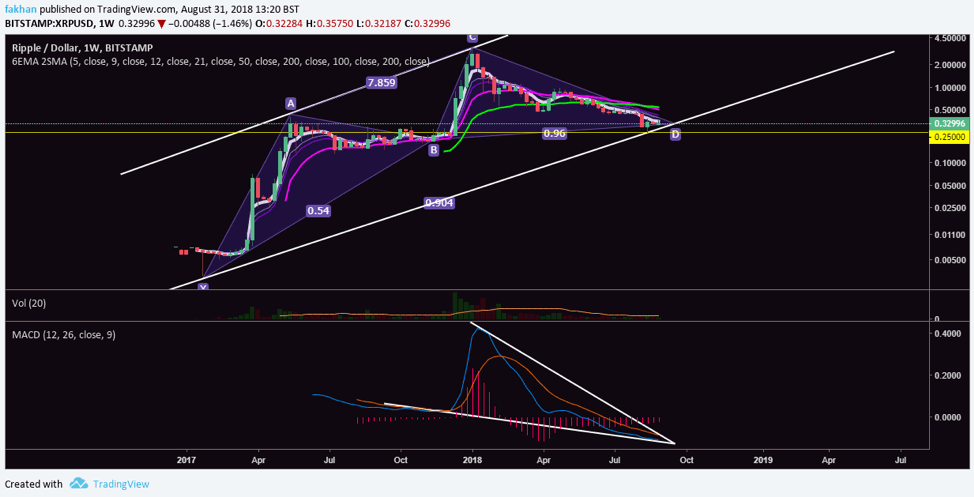
The long term outlook for XRP/USD is clear as the chart above shows. The price has almost completed the full extent of its correction against the US Dollar. MACD profile for the above chart shows that Ripple (XRP)’s MACD has been trading in a falling wedge and is due for a massive rally upwards before the beginning of October. The price of Ripple (XRP) has been in a bullish gartley pattern against USD since the beginning of 2017. If history is any indication, the price of Ripple (XRP) is expected to take off from these levels and begin a new cycle assuming demand for XRP continues to grow.
So far, Ripple’s partners like Western Union that have been testing XRP to replace their nostro accounts are not sold on the idea of XRP being the solution to their problems. However, given the fact that XRP has one of the lowest transactions costs and one of the highest transaction speeds among most cryptocurrencies, it is likely that XRP will continue to have its use in the future whether banks use it or not.


