Ripple (XRP) Needs Further Consolidation if it is to Push Higher
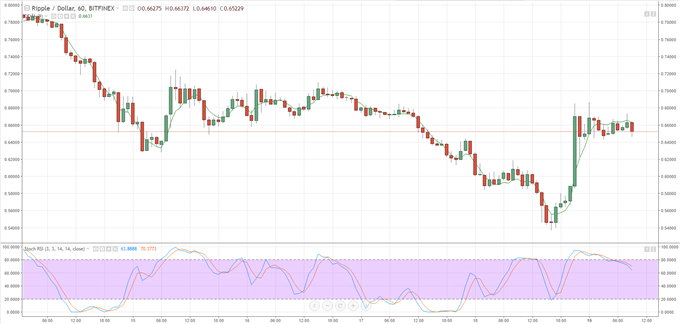
The volatile trade over the weekend saw Ripple drop form $0.68 to a low of $0.53 in a 24-hour period before rallying back to a current level of $0.65. The fall was part of a wider sell-off in the whole cryptocurrency space that saw the market’s capitalization hit a four-month low of $276 billion. Korean Won buyers were noticeable, trading at an average price of $0.678 at the Bithumb exchange.
The one-hour chart highlights the sharp rebound but still leaves the market undecided on the next move with lower prices still more likely with the green $0.58 to $0.68 one-hour candle vulnerable likely to be re-tested.
Ripple (XRP) Price Chart One Hour Time Frame (March 15 – 19, 2018)
We will be discussing a range of cryptocurrency charts and price set-ups at our Weekly Cryptocurrency Webinar every Wednesday at 12:00 GMT.
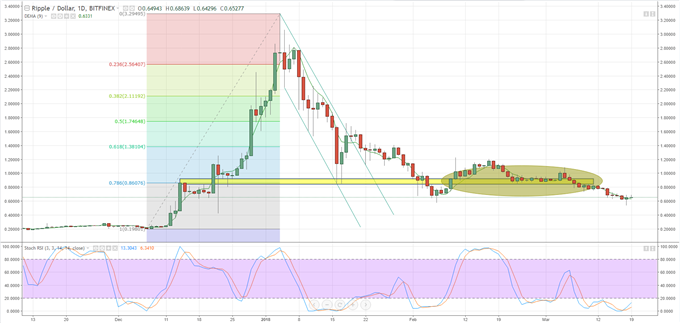
The daily Ripple chart still highlights strong resistance starting at $0.85/$0.86 area and is expected to hold unless market fundamentals change completely.
Ripple (XRP) Daily Price Chart in US Dollars (November 11, 2017 – March 19, 2018)

Cryptocurrency Trader Resources – Free Practice Trading Accounts, Guides, Sentiment Indicators and Webinars
If you are interested in trading Bitcoin, Ethereum, Litecoin, Bitcoin Cash or Ripple we can offer you a range of free resources to help you. We have an Introduction to Bitcoin Trading Guide along with a Free Demo Account . In addition we run a Weekly Bitcoin Webinar and have an IG Bitcoin Sentiment Indicator to help you gauge the market and make more informed trading decisions.
Read more at:
https://www.nasdaq.com/article/ripple-xrp-bounce-back-should-be-treated-with-caution-cm936429


