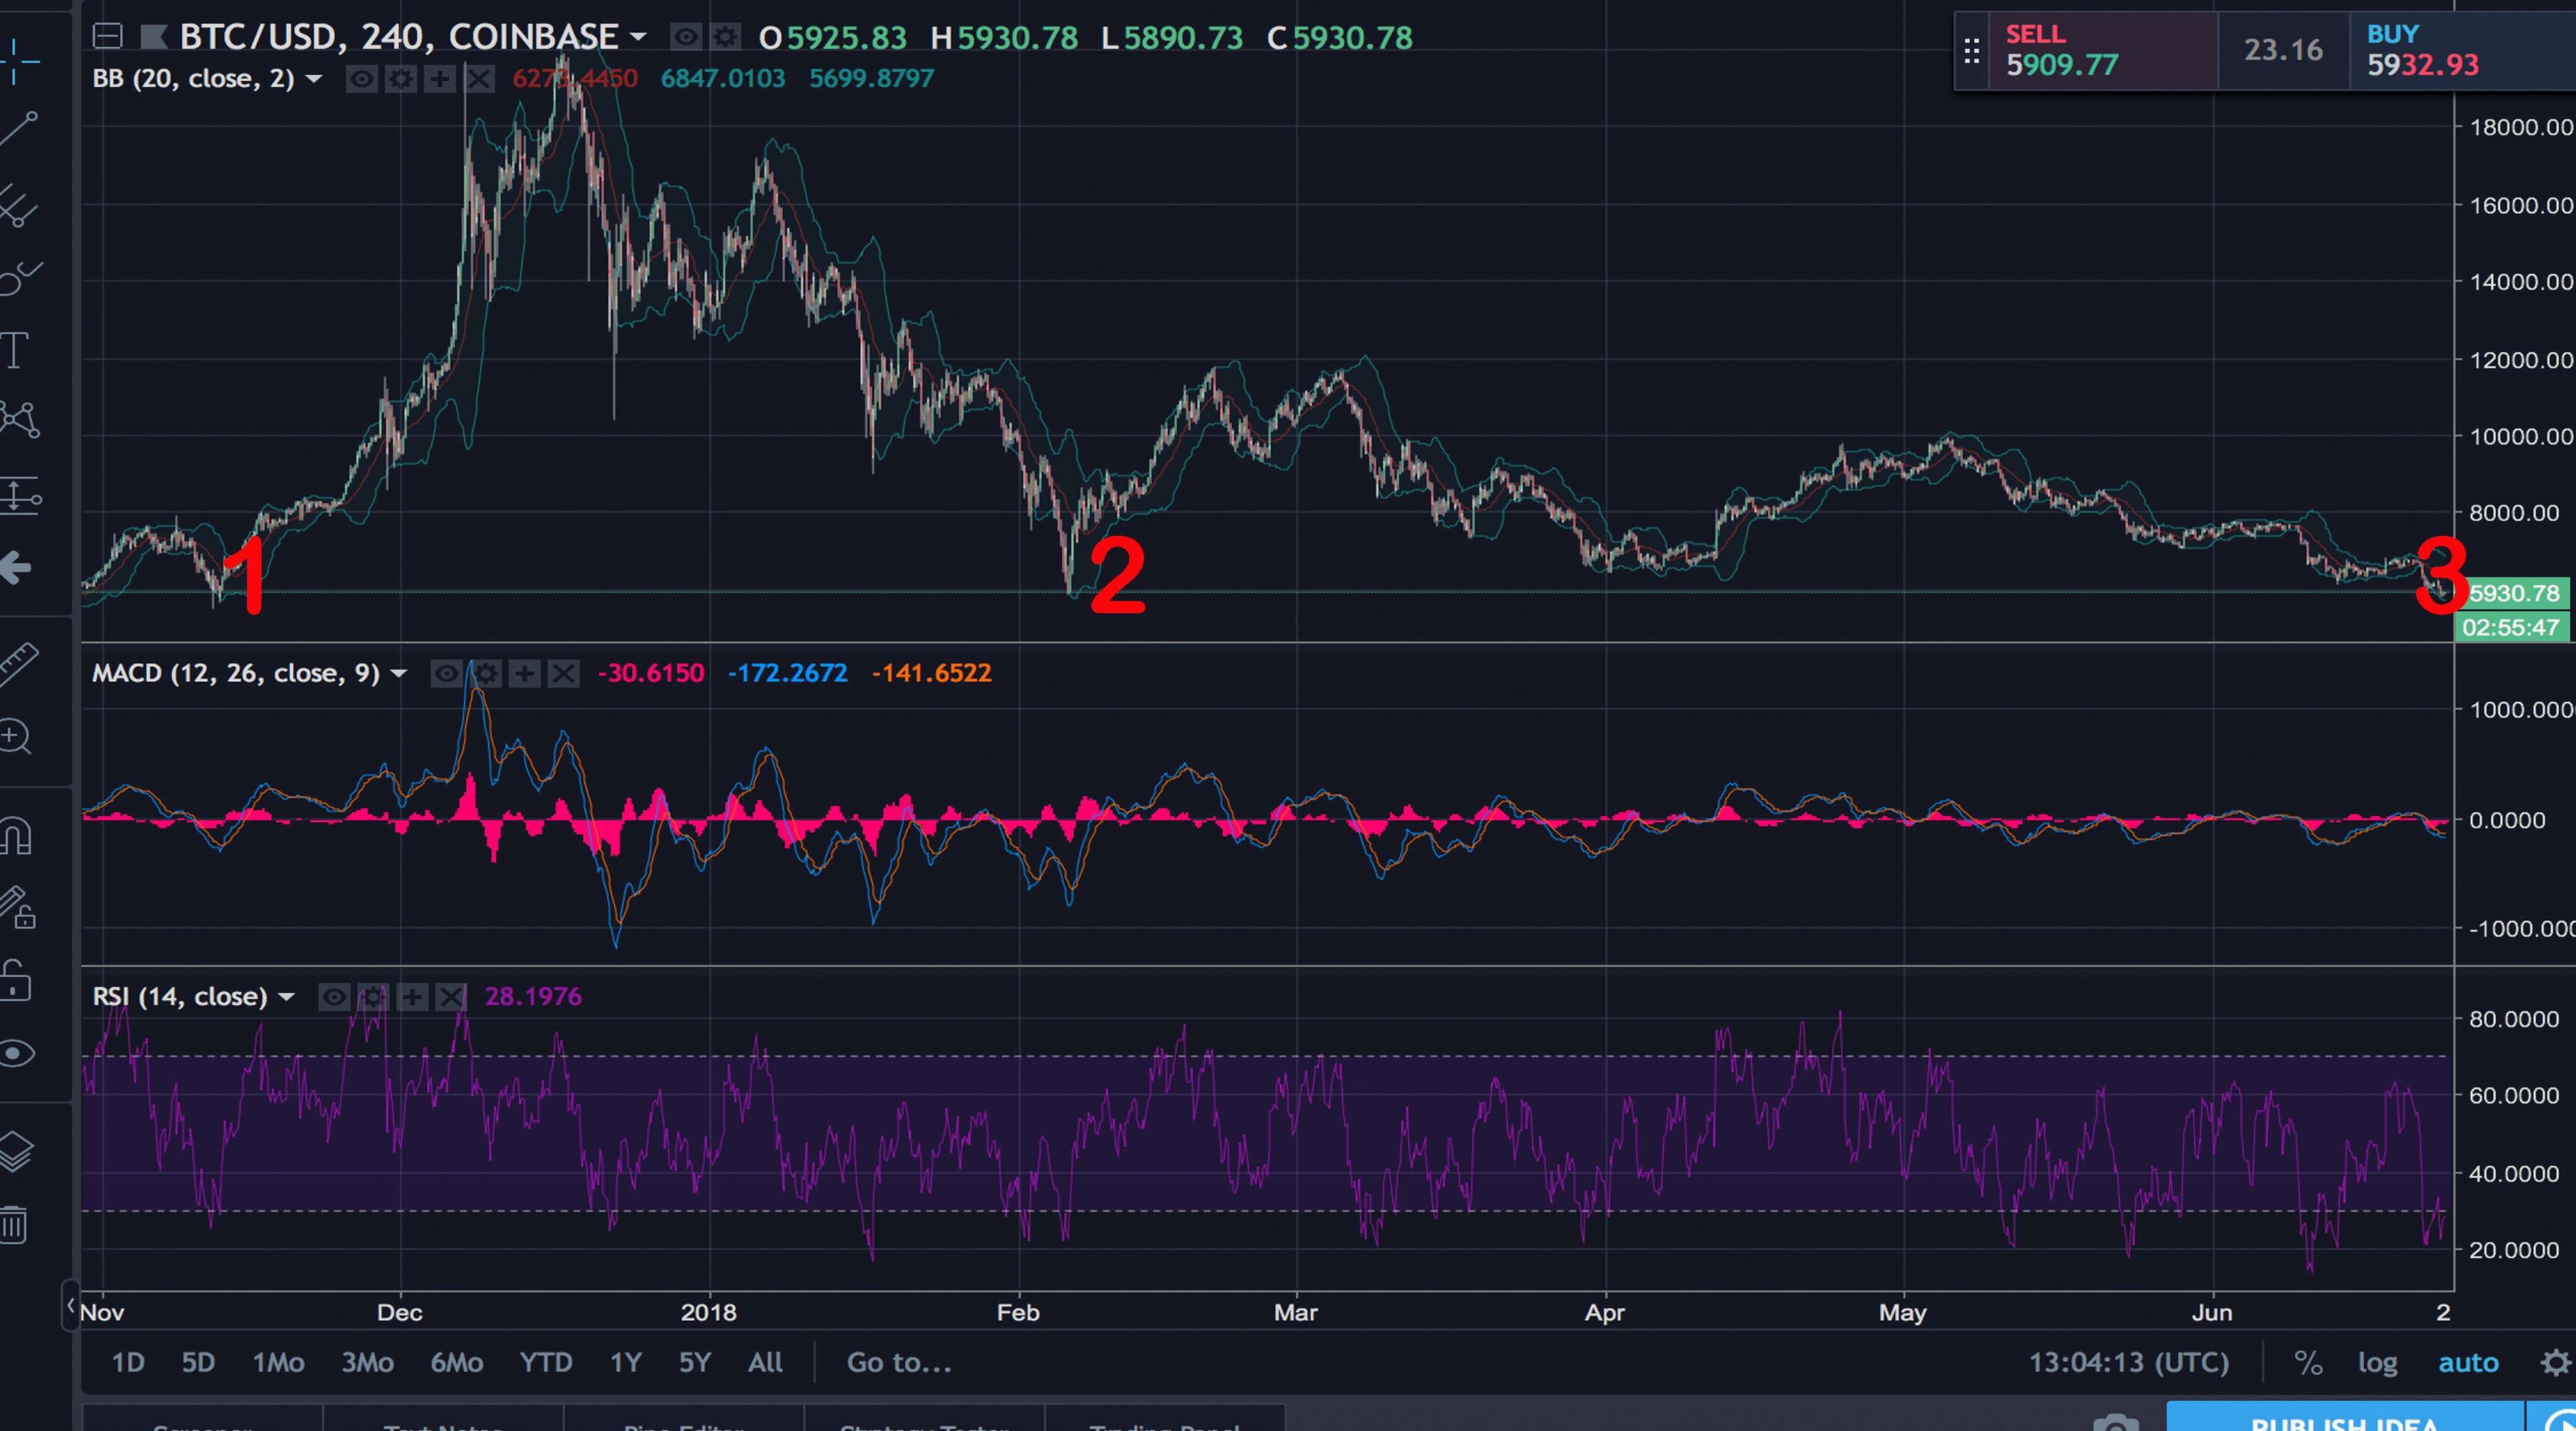
Cryptocurrency bears are still clawing away at digital asset prices on Sunday, June 24 as most of the digital currency market values are down between 3-12 percent over the last 24-hours. The top cryptocurrency market held by bitcoin core (BTC) has touched a triple bottom at $5,832 during the early morning June 24 trading sessions. The last two times BTC dropped to these price ranges was in November 2017, and last February. Some traders believe a third bottom indicates significant support and cryptocurrency prices could capitulate after breaking through resistance levels.
riple Bottom Achieved: What’s Next for Crypto-Markets?
When will the 2018 cryptocurrency bear market end? Will digital currency markets experience a bear run every four years? These are the questions many traders and speculators are asking as some are in desperate search for that ever elusive ‘bottom.’ Cryptocurrency market prices are pretty low today on June 24 as the entire market capitalization of all 1600+ digital assets is around $242Bn at the time of publication.

As we mentioned above the last time prices were this low was back in February of this year and November 2017. However, even though 2018 has been a rough year so far there has been a lot of new infrastructure announcements, a wide variety of investment vehicles and trading platforms, new applications, and innovation taking place on the sidelines as everyone is hypnotized by the falling prices.
Bitcoin Cash (BCH) Market Action
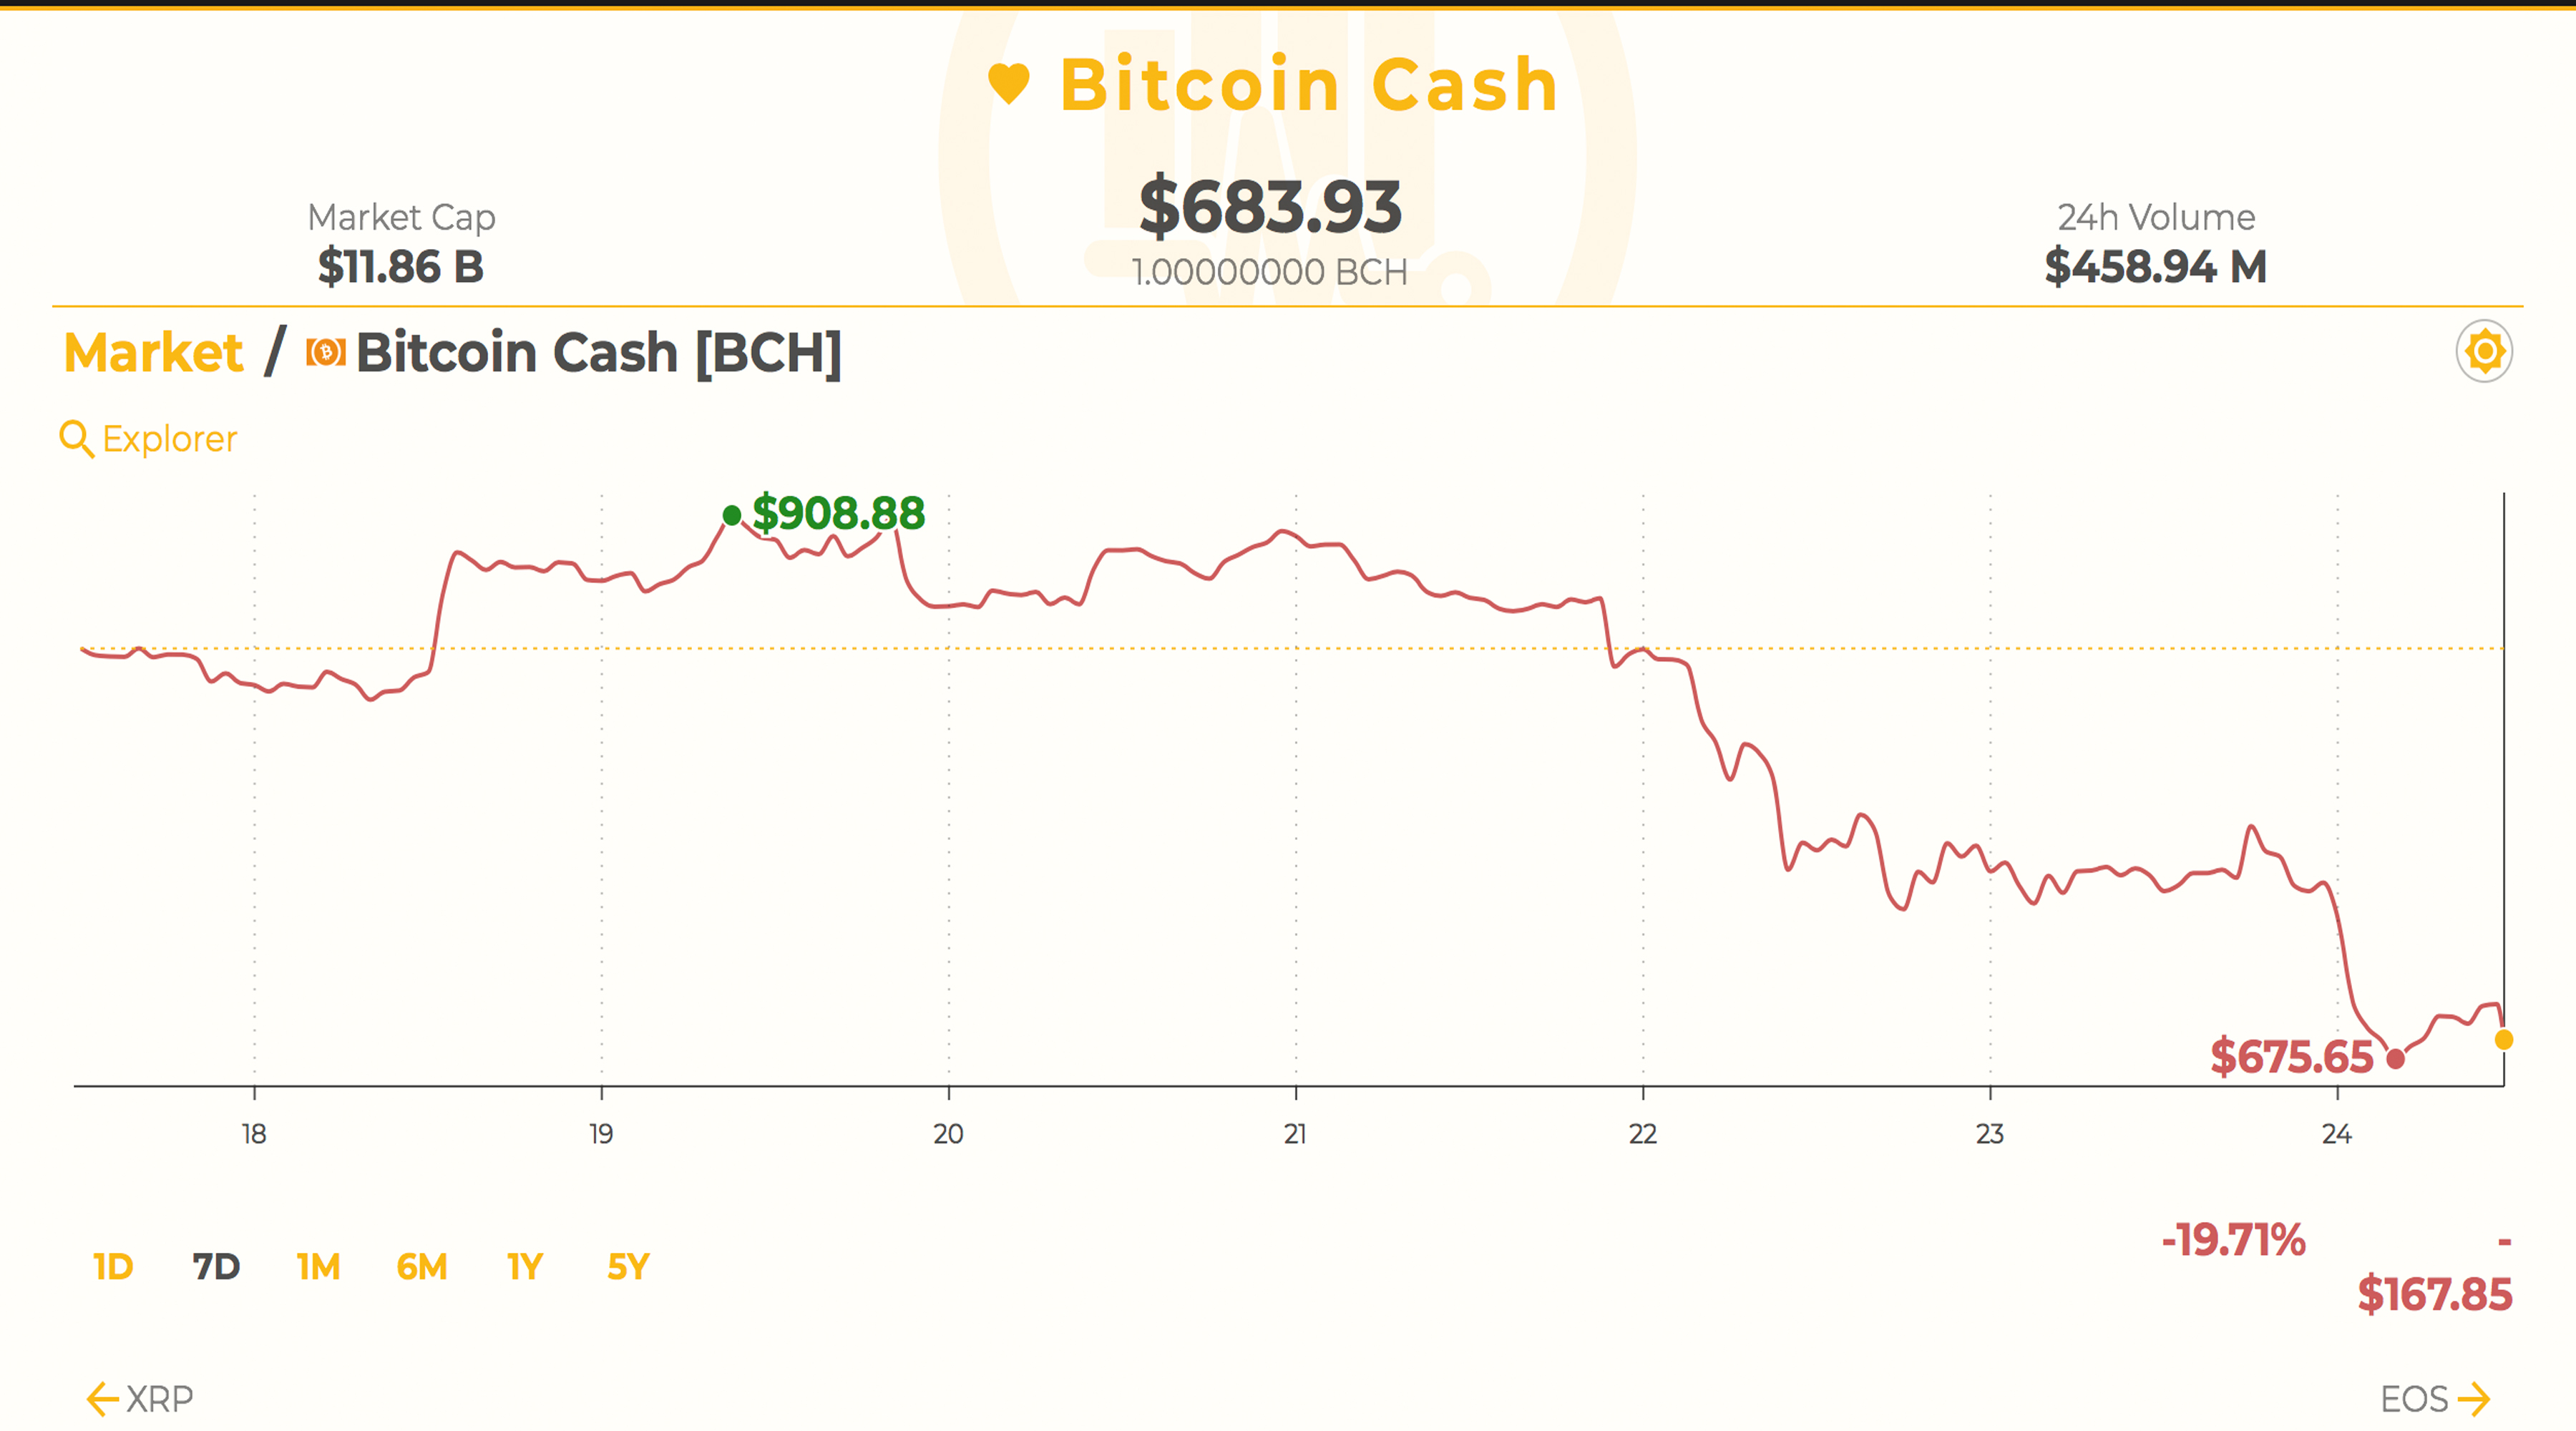
At the moment bitcoin cash (BCH) markets are seeing extremely low prices not seen since last February as the price per BCH is around $683. The overall BCH market valuation has dropped to $11.8Bn losing $1.4Bn since last Friday. BCH markets are down 8.5 percent over the last 24-hours and 19 percent over the last week. BCH trade volume, although way lower than Q4 2017, is still holding steady at $458Mn or more for 24-hour volumes. The top exchanges swapping most of the bitcoin cash trading volume today include Okex, ZB.com, Bitfinex, Huobi, and EXX. The top currency traded with BCH today is BTC by 46.2 percent which is followed by tether (USDT 23.8%), USD (18.7%), KRW (4.4%), and the EUR (1.5%).

BCH/USD Technical Indicators
Looking at the 30-minute and 4-hour charts for BCH/USD on Bitfinex and Bitstamp shows a small recovery is taking place since the initial drop this morning. The two Simple Moving Averages to watch (100 SMA & 200 SMA) still have a decent gap with the long-term 200 SMA above the short term 100 trendline. This indicates a move to the downside could take place again in the near future. MACd and RSI levels (44) are heading northbound after showing oversold conditions which also shows BCH bulls are trying to fight back. Despite the fact that a psychological price barrier was broken the market is showing strong foundations. Looking above at sell walls BCH bulls need to break through $750 and $800 to show some comeback strength. Below that, if bears remain in charge they will be stopped by significant buy walls at the current vantage point until just before $600.

Bitcoin Core (BTC) Market Action
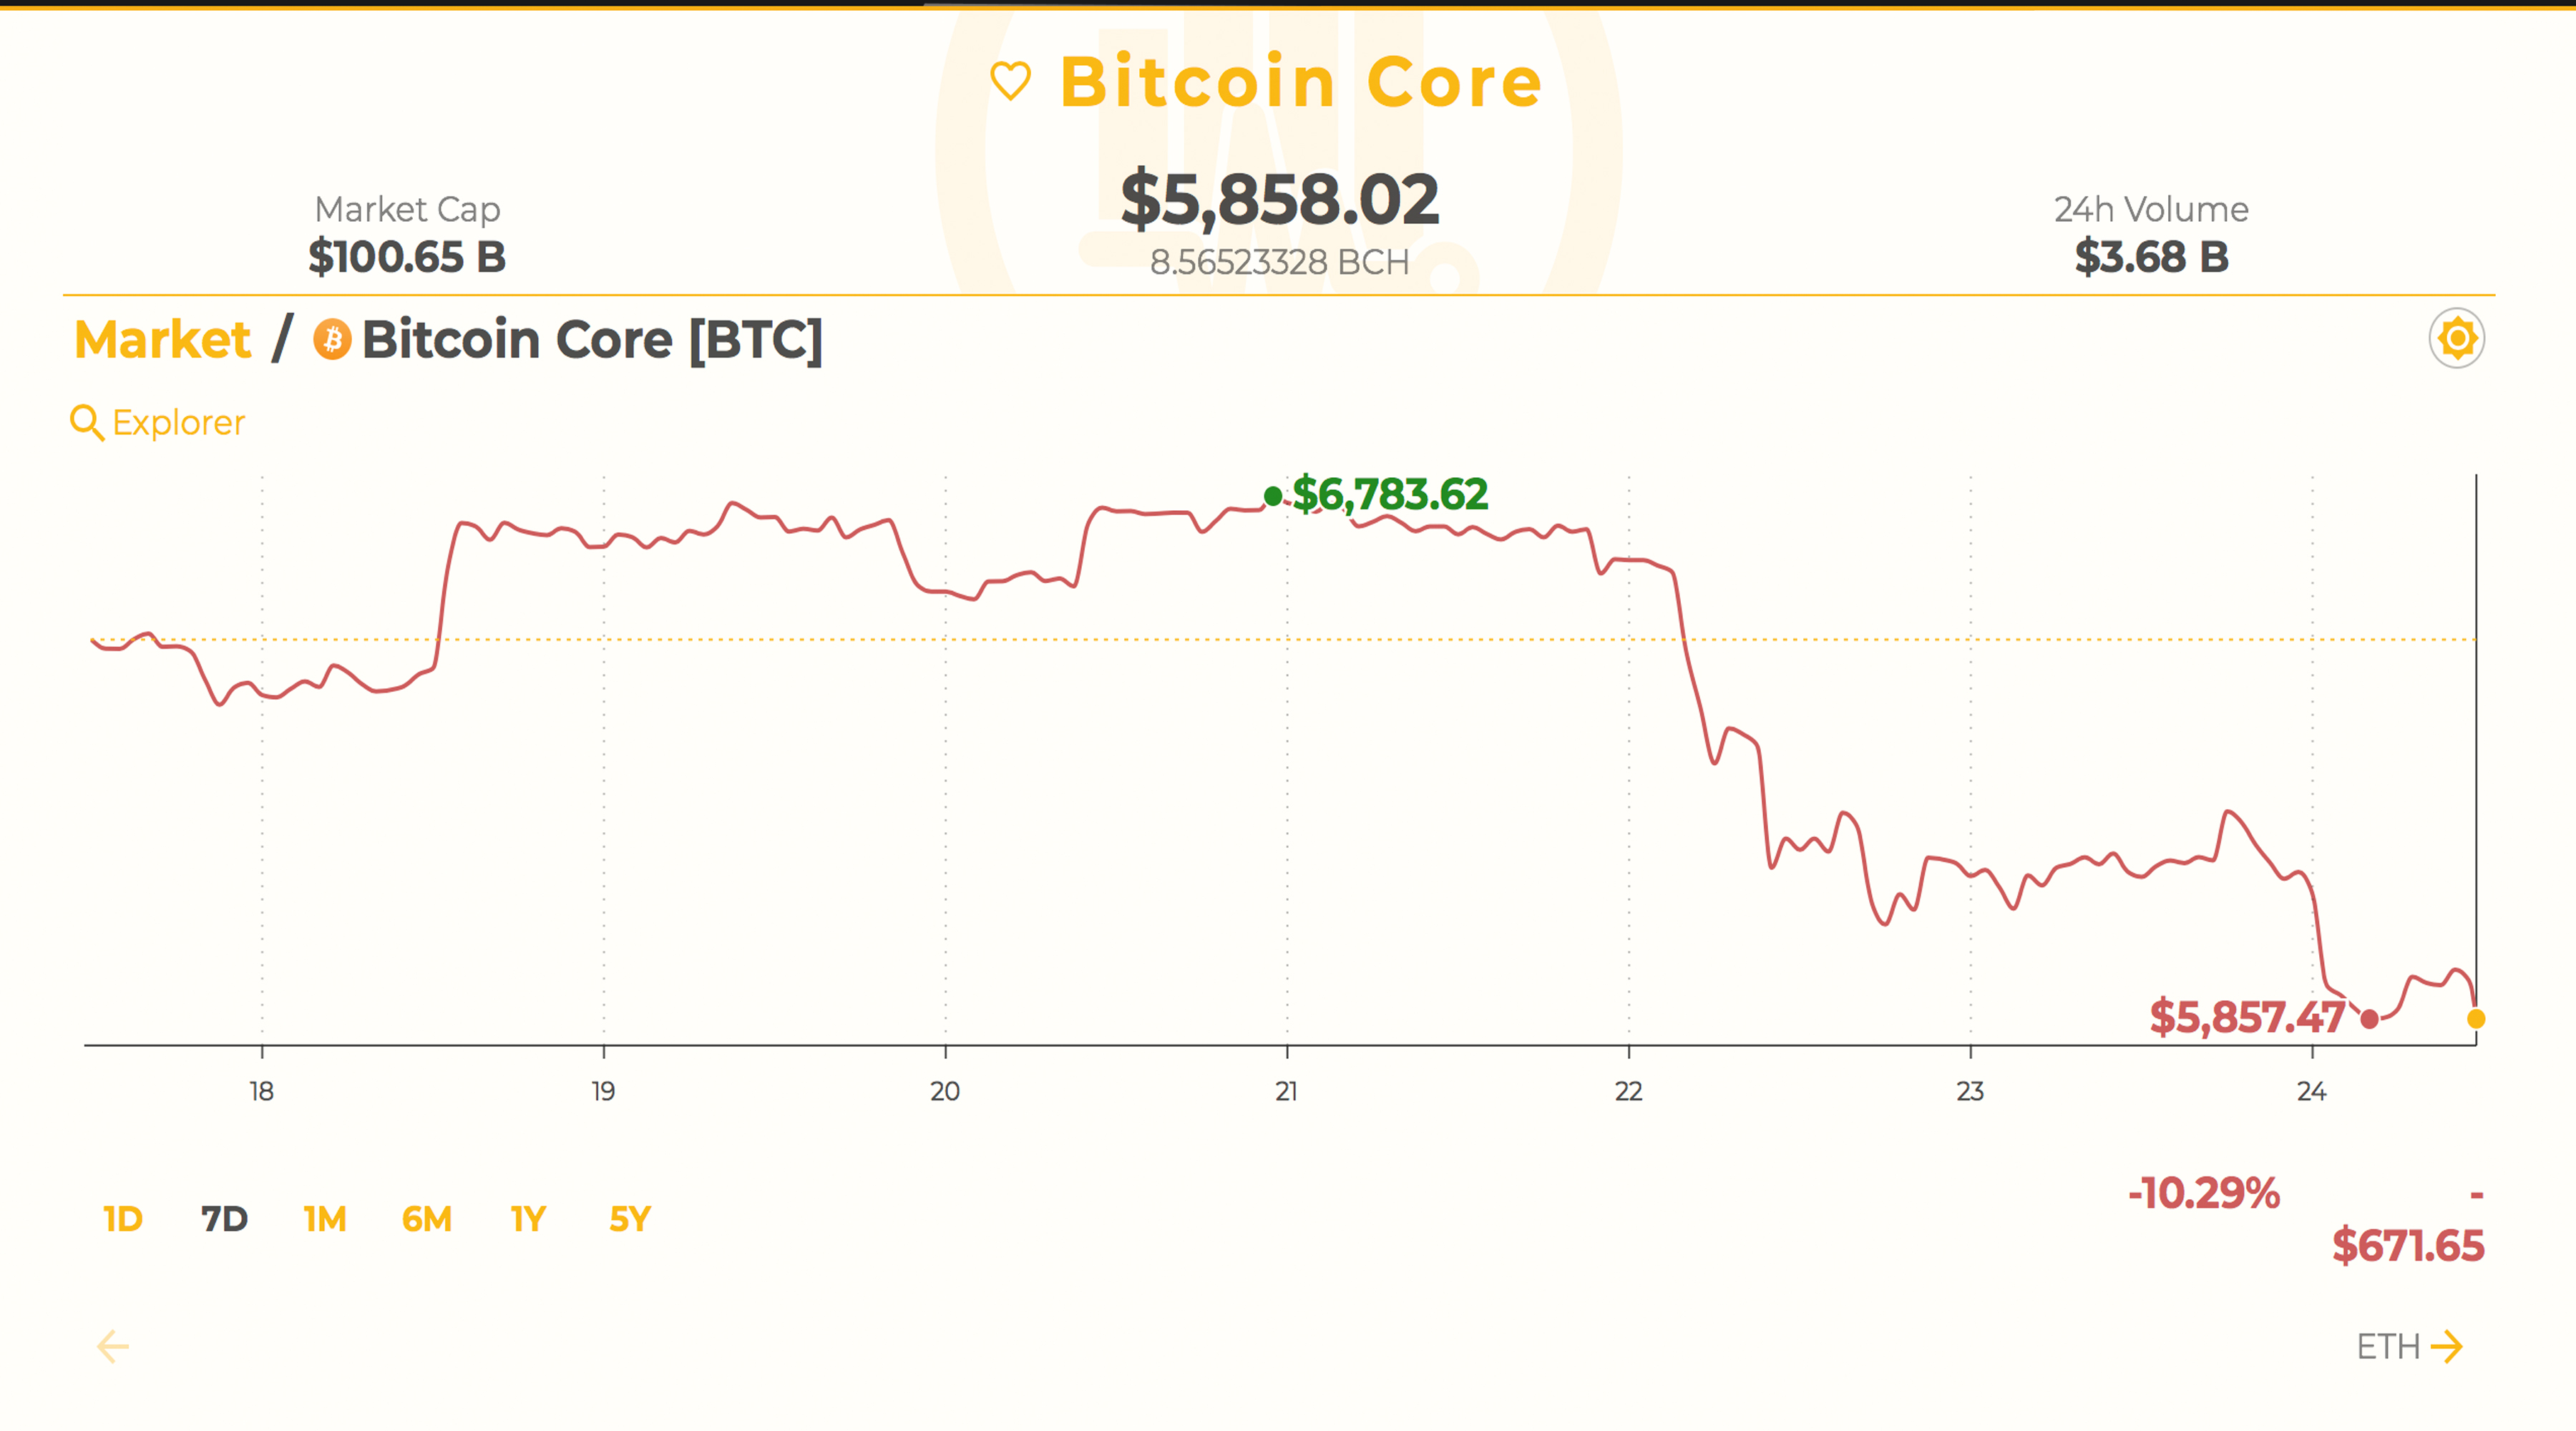
Bitcoin core (BTC) markets are seeing an average spot price of around $5,858 at press time with $3.6Bn in 24-hour trade volume. BTC volume is lower than last Friday as trade volume has dipped around $625Mn since before the weekend. Even though BTC prices have been dropping, market dominance amongst all the other cryptocurrency markets is increasing slowly and hovers at 41 percent today. The top trading platforms exchanging the most BTC today are Binance, Bitfinex, Okex, Coinbene, and Huobi. The Japanese yen according to the data site Crypto Compare is grasping over 69 percent of today’s BTC trades. This is followed by the USD (13.4%), tether (USDT 12.8%), EUR (1.8%), and the KRW (1.3%)

BTC/USD Technical Indicators
Looking at charts for BTC/USD on Coinbase and Bitstamp shows some triangular action and some deep consolidation. Bollinger bands are extremely tight as we enter the triple bottom region. The two SMA trendlines are similar to BCH/USD charts with the long-term 200 SMA above the short term 100 SMA. This means the bearish sentiment is not over and could likely continue after a small price reprisal in the short term. MACd and RSI levels (26) are also starting to move northbound after signs of oversold conditions. BTC bulls need to muster up the strength to surpass hefty resistance levels from the current vantage point up until $6300 to make better progress. On the backside, bears will see strong foundations between now and $5100 which could last a for some time.

The Top Cryptocurrency Markets Are Feeling the Pain Especially EOS
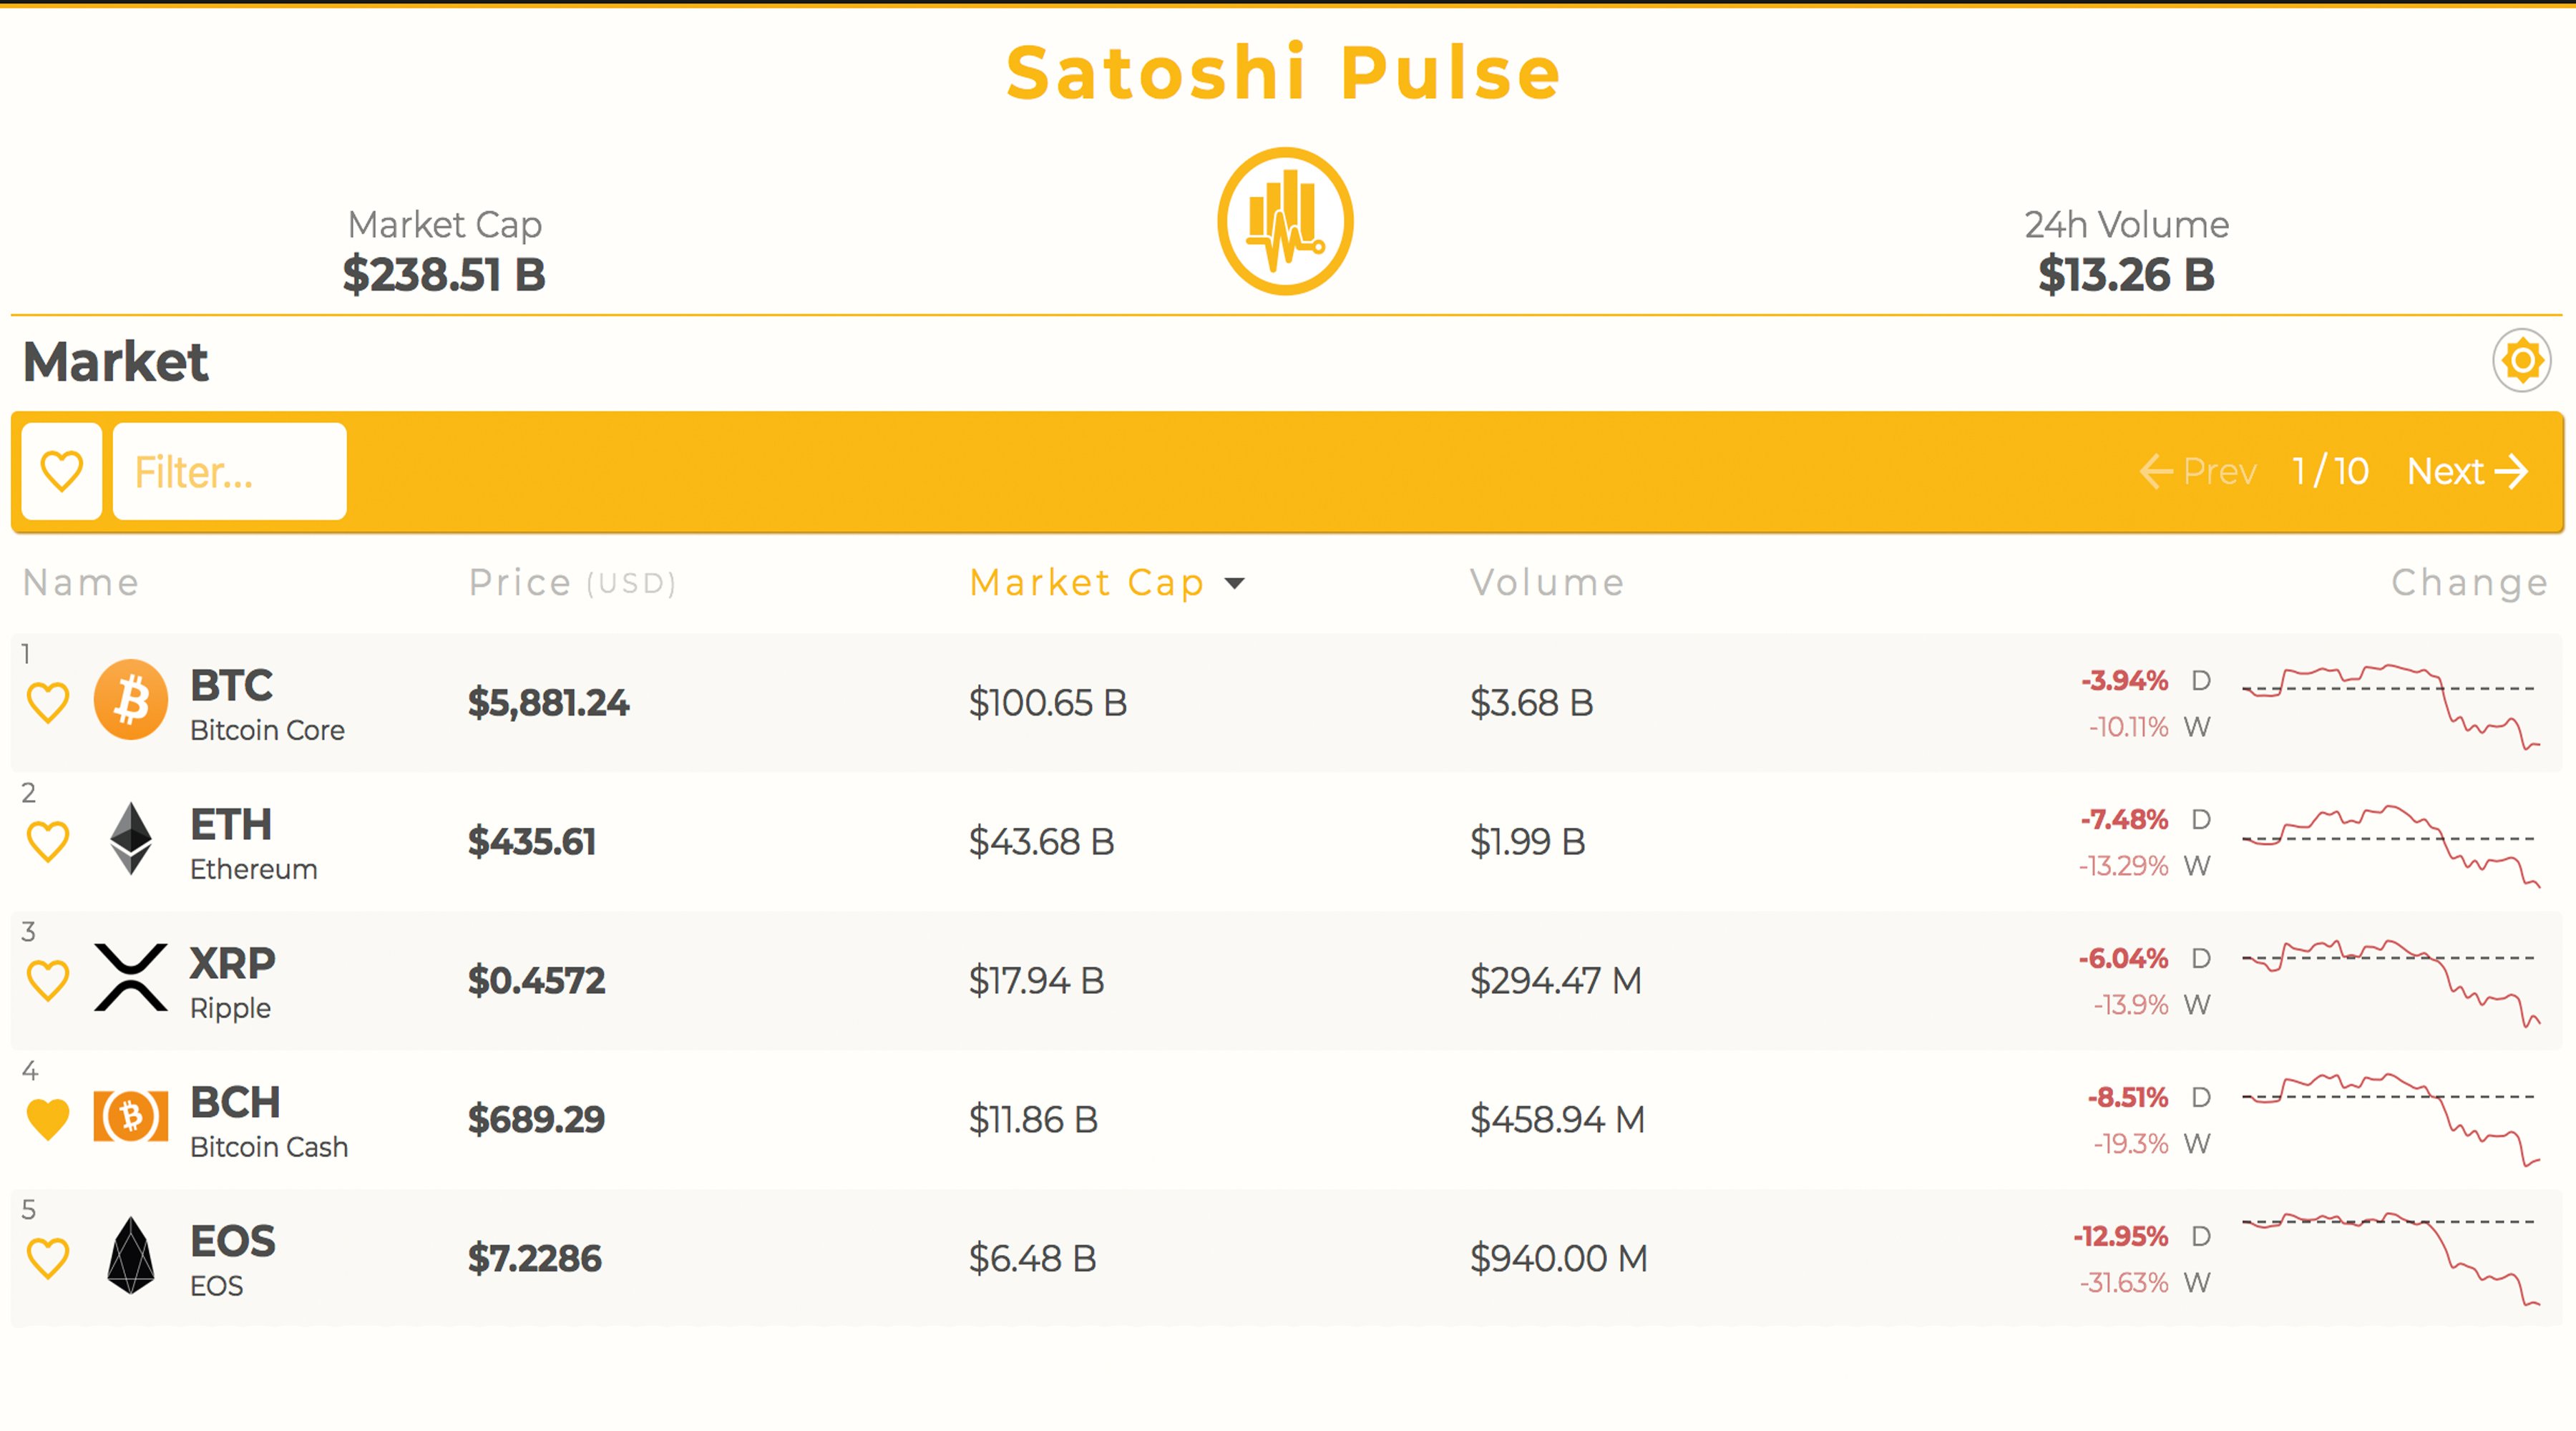
Overall most digital assets today are hurting and are nurturing wounds as bears have scarred markets pretty badly since the beginning of the year. The second largest market capitalization belonging to ethereum (ETH) markets is down 7.4 percent this Sunday. Over the last seven days, ETH has lost 13.2 percent and the price per ETH is around $435 per coin. Ripple (XRP) markets are hovering around $0.45 cents per XRP as markets have lost 6 percent over the last 24-hours. Lastly, the fifth highest valued cryptocurrency market commanded by EOS has lost 12.9 percent over the last 24-hours and a harsh 31 percent during the last seven days. One EOS is trading for $7.22 per coin when last Friday it traded for $8.60 per EOS.

The Verdict: Triple Bottom Tea Leaves Add Some Positivity, but Skepticism Remains Strong
As we stated above many are in search of the elusive bottom when it comes to this crypto-bear market in 2018. Skepticism and mass speculation is taking place amongst traders as the triple bottom has everyone wondering if we will now see a trend reversal.
Read more at: News Bitcoin


