- Five days on the cliff putting pressure on those who came last to the pitch.
- Our “Technical Confluence Indicator” tool indicates less consistent support lines than the challenges that pose the key resistance levels.
BTC/USD 1D
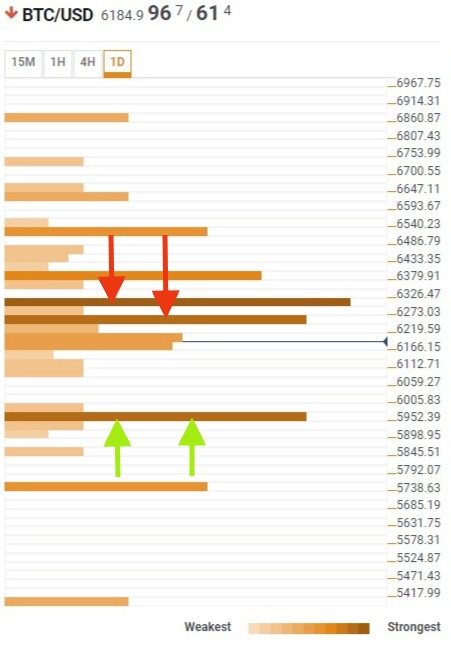
The Bitcoin trades at $6,166, slightly lower than yesterday’s highs at $6,345. The BTC/USD did not succeed in their attempt to conquer the $6,400 level, and now it is moving straight to the cliff, acutely aware that a short skydive could be close.
Below the spot price, the first remarkable support is the 23.6% Fibonacci retracement on a weekly basis, at the $6,150 level. The S1 level of the Pivot Points calculations on a daily basis is located $45 below, at $6,105. It is not up until $200 below, at $5,940, where the confluence of monthly and weekly lows could provide BTC/USD some reliable support.
Above the current price level, BTC/USD has also much more room to move up until finding a stiff resistance at $6,300 level, where the 38.2% Fibonacci retracement on a weekly basis is waiting. Compared to the analysispublished yesterday, this level of resistance has been reinforced with the addition of the 23.5% Fibonacci retracement on a daily basis.
At the Bitcoin bullish end, the daily R1 Pivot Point waits around the $6,350level and, slightly above, we can find the monthly S1 Pivot Point level.

ETH/USD 1D
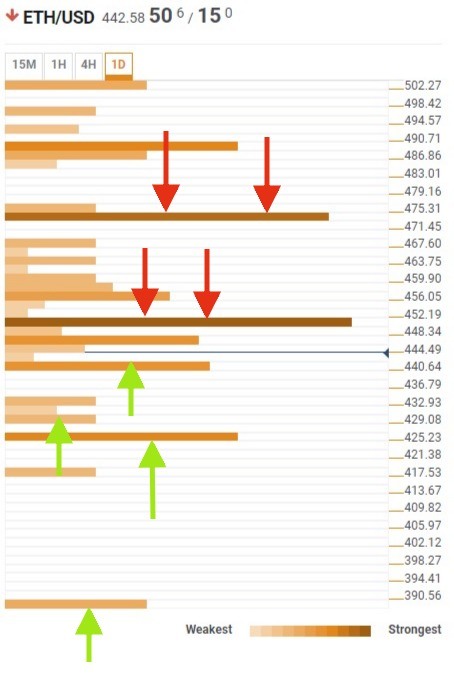
The Ethereum has some good footholds to avoid falling down, but they are a bit far apart, and that complicates the scenario. ETH/USD trades now at $445, close to the $440 level where Ethereum should find some meaningful support, in this case, the S1 level of the Pivot Point calculation system on a monthly basis. Below this powerful support, ETH/USD will find the S2 Pivot Point on a daily basis and the weekly S1 Pivot Point level on the $430/$425range. As the ultimate safety net, Ethereum has the weekly S2 Pivot Point below the $390 level.
If there are not many barriers underneath the current price, there are tough obstacles on the upside. ETH/USD would find the monthly and weekly lows above the $450 level also protected by the daily S1 Pivot Point indicator a few dollars below. Only if ETH/USD exceeds the daily R1 Pivot Point level placed at $475, we could think of a more comfortable scenario.

XRP/USD 1D
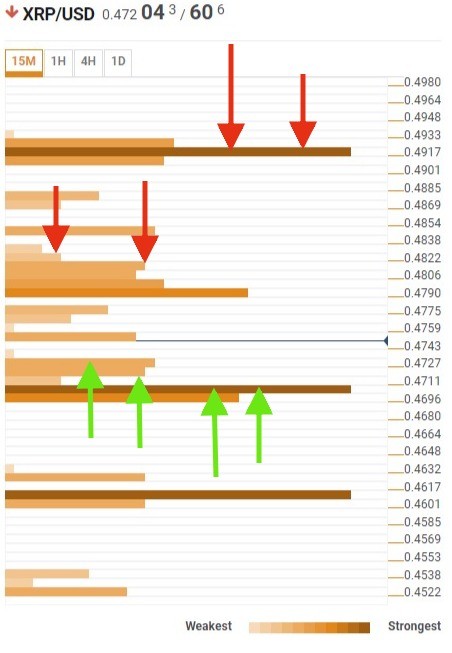
Among the three assets analyzed with the help of our technical convergence tool, XRP/USD is the one that enjoys the most solid support. XRP/USD trades now at $0.47, only 2 cents above of a strong confluence level, formed by the 1D high, the daily S1 Pivot Point and the weekly and monthly lows, besides some short-term supports.
On the upside, it is not until the $0.48 level that XRP/USD could meet some resistance with the 61.8% Fibonacci retracement level in the daily timeframe, followed by the 38.2% Fibonacci retracement at the $0,485 price level. A little higher, at the $0.492 level, we should expect the day’s highs as the level to beat.

Read more at: FX Street


