


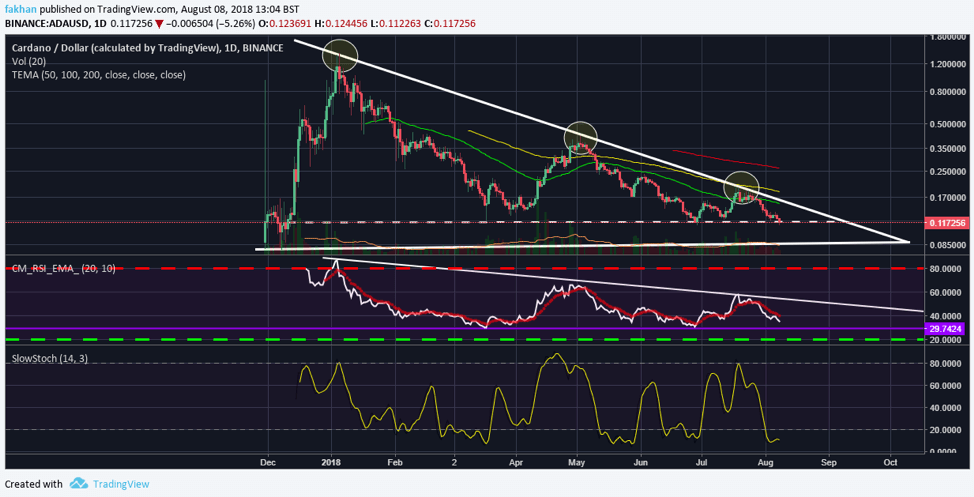
Cardano is now down 90% from its all time high after hitting a new low yesterday that knocked the price down to $0.117 as can be seen on the ADA/USD daily chart above. The last time Cardano (ADA) dropped to this level, it rallied back to the test the upper limit of the triangle. However, this time that does not seem likely. Cardano (ADA) will most likely fall below the dotted line to test the bottom of this triangle. A short term recovery can be expected given that RSI and Stochastic conditions are now oversold. However, the EMA alignment continues to be strongly bearish and a fall to the bottom of the triangle seems inevitable at this point.
The upper limit of this triangle has only been tested three times now. All of these times, the overall conditions were such that the Slow Stochastic indicator peaked as the price of Cardano (ADA) touched the downtrend resistance (upper limit of triangle). If the price were to test the upper limit of the triangle at this stage, the most likely scenario would be that it would break past that resistance line. Given that overall market conditions still favor bearish momentum, it is less likely that the price will test the downtrend resistance at this point, and more likely that it will break below the double bottom to test the bottom of the triangle. RSI for ADA/USD continues to be in a downtrend resistance with ample room for further downside.
Daily trading volume for Cardano (ADA) on major exchanges is on the rise. The overall sentiment is gradually turning slightly bullish as a lot of investors still believe that Cardano (ADA) is one of the most undervalued cryptocurrencies in the market. However, it has performed poorly against both the US Dollar (USD) and Bitcoin (BTC) so far. It has some room to go on the ADA/USD chart to complete its correction, but it seems to have reached a critical point against Bitcoin (BTC). The next few days have the potential to decide Cardano (ADA)’s outlook for the remaining half of the year.
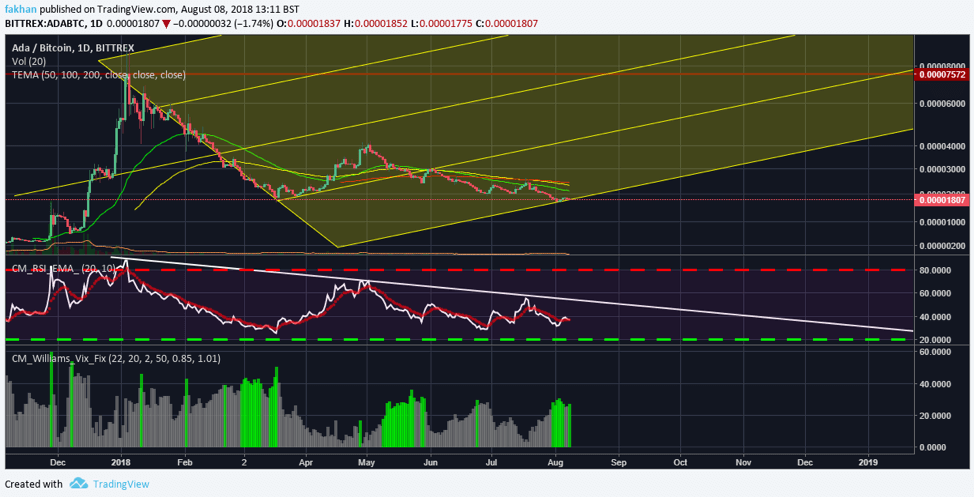
Cardano (ADA) trades on the last support line of the pitchfork it has been trading in against Bitcoin (BTC) as can be seen on the ADA/BTC daily chart above. The price action has respected this pitchfork since thebeginning of this correction. The price entered the third portion of this pitchfork in March and traded inside it till June. Since then, it has traded effectively in the fourth (last) portion of the pitchfork and is now at the brink of breaking below it.
Technical indicators indicate that Cardano (ADA) might have just found a bottom against Bitcoin (BTC). However, if a weak Bitcoin (BTC) drags Cardano (ADA) below this pitchfork, it would mean a long term bear market for Cardano (ADA) and the price would then be expected to undergo the full extent of its correction by dropping all the way down to 300 satoshis.
