


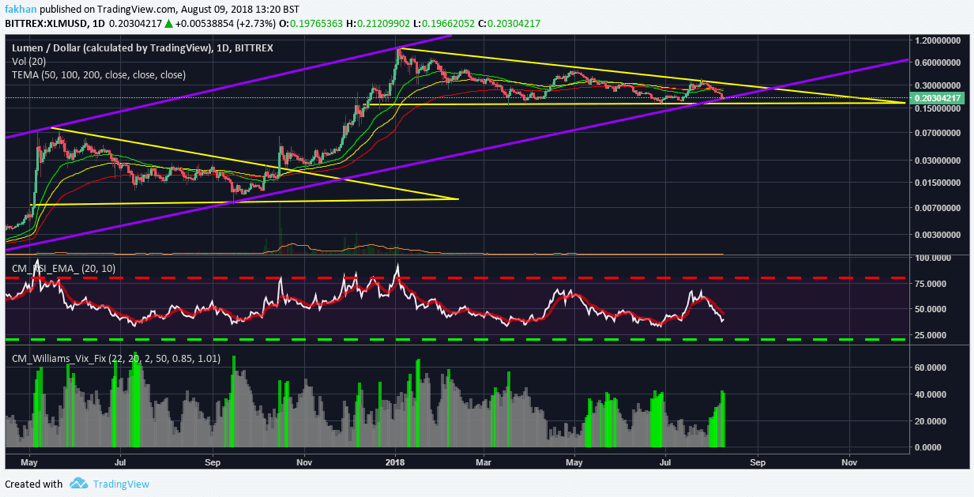
Stellar (XLM) is at the same point it was back in October, just before a massive rally. The daily chart above for XLM/USD shows that the price of Stellar (XLM) has now touched the support line. RSI and Vix indicators for Stellar (XLM) show that the price has either reached a bottom or is very close to reaching it. Stellar Lumens (XLM)’s RSI is at a level where a big rally from here on out seems favorable. The price is currently trading just above 20 cents, down from 33 cents in late July. The price action appears bullish but Stellar (XLM) has to remain above the support line in order to begin a new cycle at this point.
Congruent fractals of similar triangle and wedges are the hallmark of Stellar (XLM). While other coins often rally or correct in a haphazard manner, Stellar (XLM) likes to follow the rules and that is why most technical analysts love it. Stellar Lumens (XLM) formed its last triangle in March which extended all the way to Feb 2018 but the price broke out of the triangle in October. Currently, the price is trading in another triangle since January 2018. The triangle extends all the way to December 2018 but the price is likely to break above or below it before September 2018.
The Vix indicator for XLM/USD shows that each time before a rally, the price has found a bottom (as shown by green bars on the lower indicator on the above chart). The closer the green bars, the more likely it is that a particular asset has truly bottomed out. This time, we have seen four of these bars formed on the chart, just in the month of August. Three of those bars are together whereas one is at a short distance. This shows that the exact bottom may not have been found yet but we are very close to finding it.
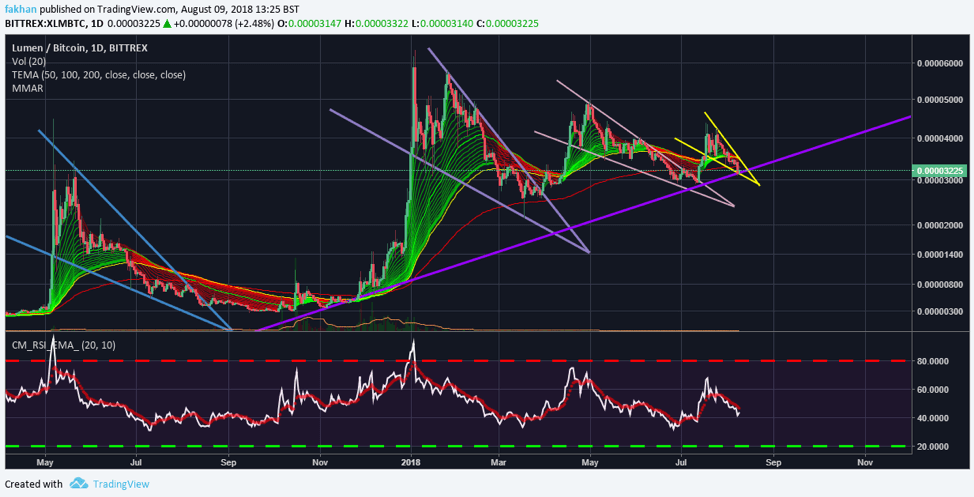
The daily chart above for XLM/BTC corroborates our analysis of XLM/USD and presents a similar bullish scenario. The price for XLM/BTC has traded in a series of falling wedges since May 2017. So far, the price has traded in four falling wedges and has broken above three of them in the past. Currently, the price is trading in another small falling wedge, just above the support line. If history repeats itself, the price can be expected to follow the same pattern and break above the falling wedge to begin a new cycle. Current RSI conditions and EMA alignment favor such a rally. The MMA ribbon on the chart above also confirms our deductions and indicates that the price has either reached a bottom or is a few weeks away from finding one. In any case, barring extenuating circumstances, Stellar Lumens (XLM) is poised for a big rally in the latter half of this year, one which will most likely begin before September 2018 and extend all the way to March 2019.
