


- A classic falling wedge pattern forming; breakout expected in the medium-term.
- The 100 SMA support seems to hold at the moment but the support at $6,400 is very essential.
Bitcoin price is forming a classic falling wedge pattern with the trendline limiting gains on the upside. The asset is battling to detangle from the selling pressure that has kept it bleeding for the most part of the week. The slight correction from the support at $6,200 was a statement that the investors have calmed down following the U.S. SEC decision to delay Bitcoin ETFs approval or denial to end of September. Investors have been reacting to the news as the price fall in yet another selloff that has seen Bitcoin stare right at $6,000.
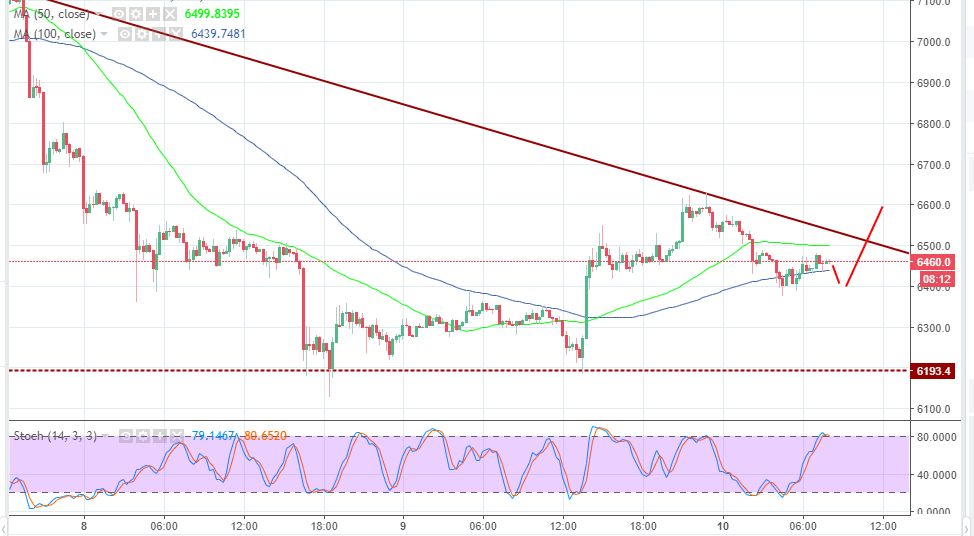
At the time of writing, Bitcoin is trading between the moving average support and resistance. Where the short-term 50 SMA is standing in the way of upside retracement at $6,500. On the other hand, the 100 SMA is offering immediate support at $6,438.8. The bullish trend in the afternoon (GMT) trading session on Thursday broke above $6,400, came into a struggle at $6,500 and later before the close of the session attacked $6,600, although failed to break above the resistance.
The declines that followed during the Asian trading hours have found a support at $6,400 but BTC/USD is currently trading at $6,459. Bitcoin has the potential to recoil above $6,500, a move that will see it breakout further towards $6,600. The next supply zone at $6,737.4 is the ultimate intraday resistance. Nevertheless, if the price declines below $6,400, a breakdown is likely to take the price back to the drawing board at $6,200 and in this case, $6,000 would be well within reach.
BTC/USD 15′ chart
