


Ethereum Classic (ETC) just got listed on Coinbase but the price has refused to budge. The weekly chart above for ETC/XBT shows that Ethereum Classic (ETC) did rise in the week the listing was due but the price failed to rise after the actual listing. This means one of two things. Either there is no real interest at the moment as the market is bearish and interest in cryptocurrencies has been on a steady decline since the correction. Another reason could be whales trying to manipulate the price so as to accumulate all they can at lower prices.
Bitcoin (BTC) and Ethereum (ETH) are big coins with a larger market cap so there are OTC markets where investors can buy coins without influencing the price. This means the whales do not have to manipulate the price to lowball; they can just buy over the counter directly from someone who wants to sell to them. As for Ethereum Classic (ETC), a coin with a market cap of just over $1 billion, there are no proper OTC markets. So, any investor with deep pockets willing to profit off Ethereum Classic (ETC)’s upcoming ride on Coinbase will have to buy on an exchange. If they are to do this in one go, it would send the price soaring. So, they use a technique called iceberg orders to manipulate the price action in order to get in at lower prices. It is pertinent to note that in the absence of proper OTC markets, this becomes a necessity for big investors.
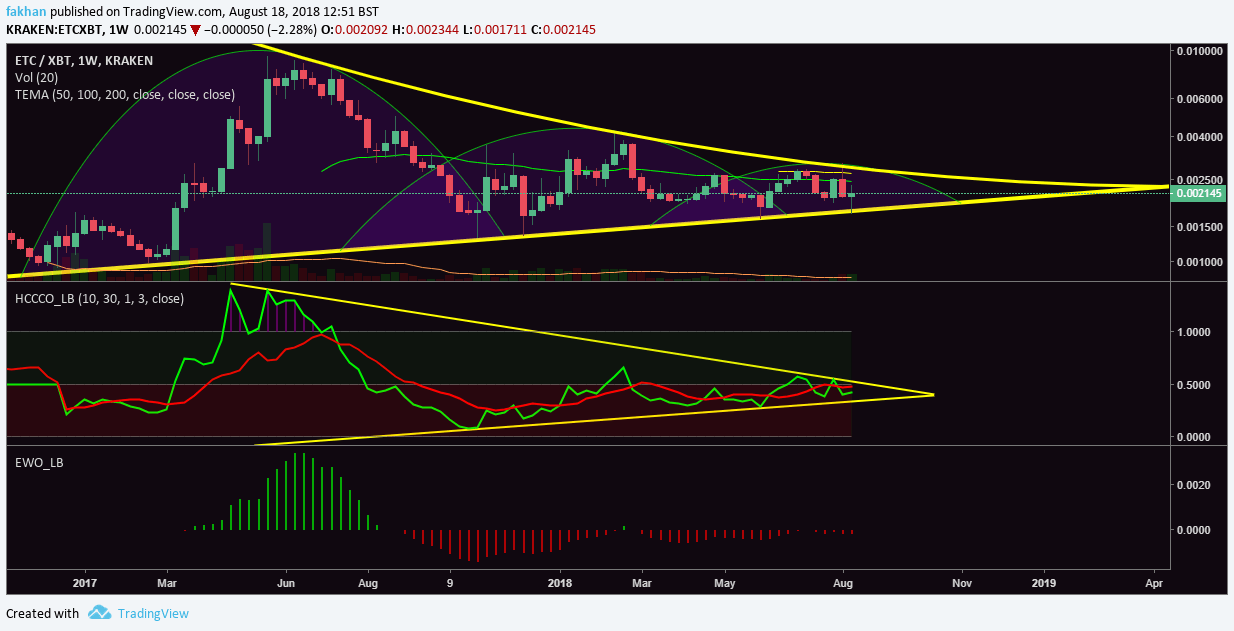
As the ETC/XBT chart above shows, the price is all set to rocket in the weeks to come. All of this has to happen before the end of the year. The HCCCO indicator on the above chart shows how the fast oscillator (green) is ready to rise above the slow oscillator (red). Every time this has happened in the past, the price has rallied upwards. Another interesting observation is the behavior of the Elliot Wave Oscillator on the above chart. EWO profile on the ETC/XBT chart shows that the bearish momentum that gained strength since the September 2017 has gradually faded away before the beginning of September 2018. The price has now reached a decision point is there is not much room left to trade inside the triangle.
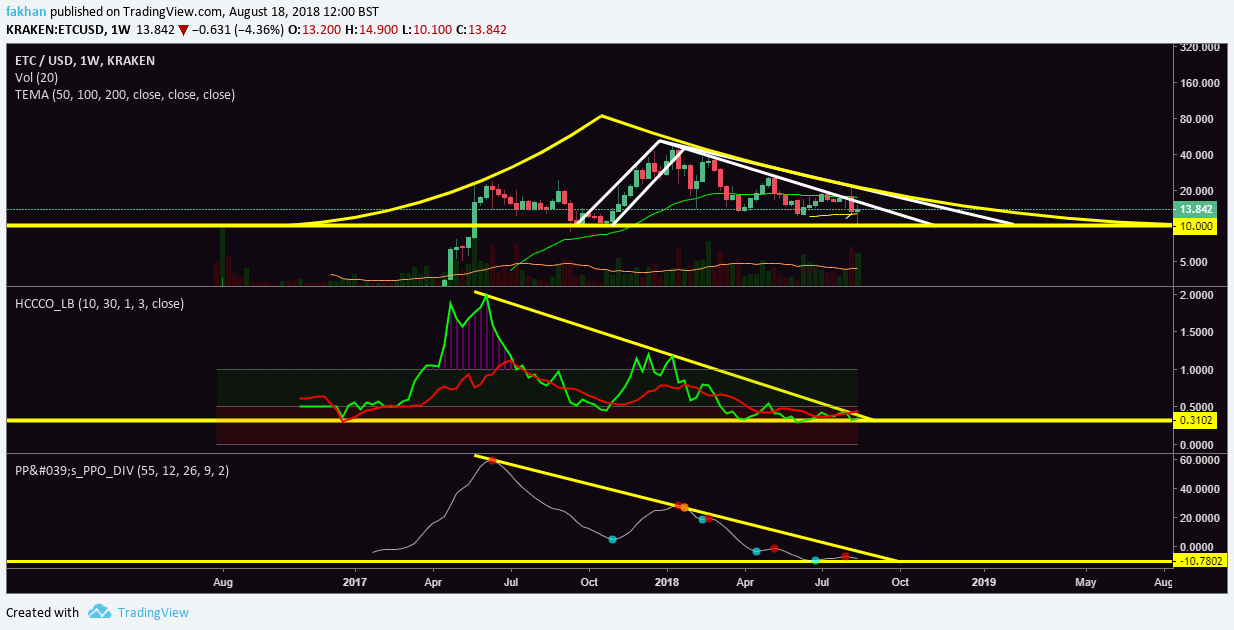
Ethereum Classic (ETC) also appears to have reached the end of its correction on the ETC/USD weekly chart above. The price is all set to break out of the triangle in the weeks ahead. For traders, buying at these prices may be risky, but selling is even riskier. For investors, accumulating at these prices is the way forward, if they do not want to miss the upcoming rally. The HCCCO indicator on the above chart signals a breakout before the end of August. The same is corroborated by the PPO divergence diagram on the above chart.
The reason “hodling” forms a big part of cryptocurrency investing is because most of the bullish moves take place in a matter of just a few weeks. The market may be in a correction or sideways movement for the whole year but big upward movements are made in just a few weeks. If you are trading cryptocurrencies, there is a high chance that you may have missed out on such rallies in the past because sometimes the price rises abruptly and continues to rise even when technical analysis suggests otherwise. This is why for long term believers in cryptocurrencies, smart accumulation is a better strategy.
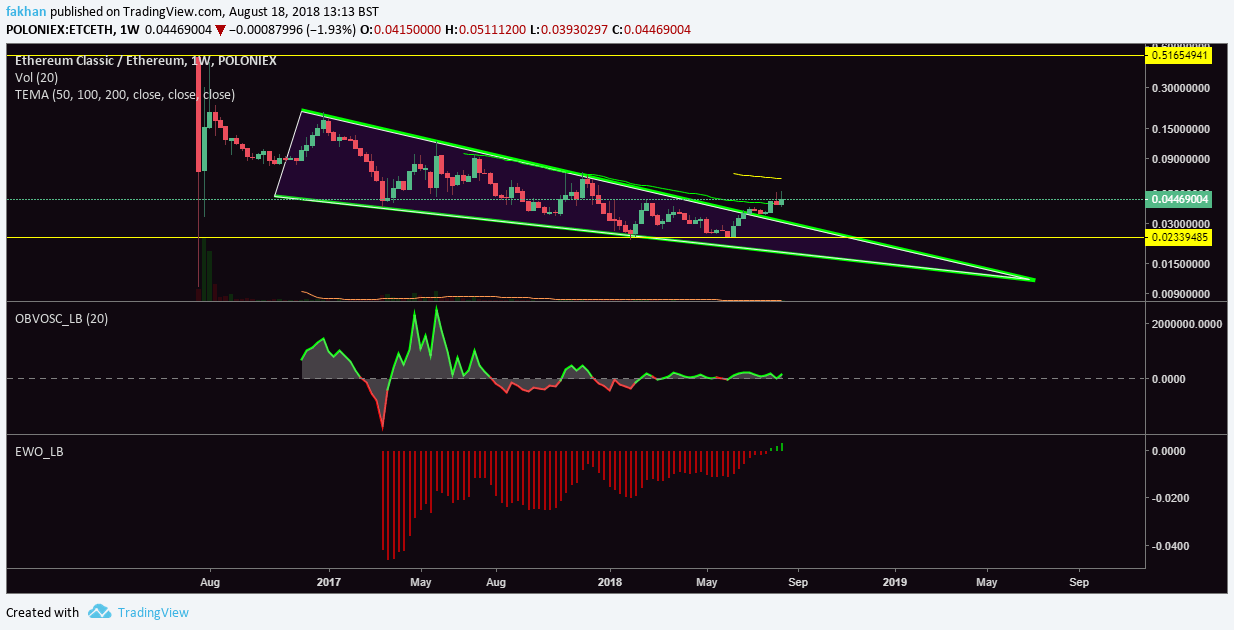
Ethereum Classic (ETC) once considered a dead project has now come forward as a serious Ethereum (ETH) contender. The above weekly chart for ETC/ETH shows that Ethereum Classic (ETC) has just broken out against Ethereum (ETH). There are plausible reasons to believe that this rally will continue for the foreseeable future. First of all, Ethereum Classic (ETC) has been on a steady decline against Ethereum (ETH) since April 2017. This trend has changed just recently as indicated by the EWO diagram on the lower half of the above chart. This trend reversal was a consequence of Ethereum Classic (ETC) breaking out of a falling wedge against Ethereum (ETH). ETC/ETH is now in an uptrend and as the OBV Oscillator on the above chart indicates, there is plenty of room to rise.
In technical analysis, most of the time fundamentals and technicals go hand in hand. During the 2014 Mt. Gox hack, the price was already ready for a fall. Similarly, before the CBOE and CME futures last year, the price had already peaked out. The futures just became a catalyst. Similarly in this case, Ethereum (ETH) has had its run and now Ethereum Classic (ETC) is just getting started to take on Ethereum (ETH). The charts (techncials) already support this but what are the positive developments (fundamentals) that will make this happen?
The answer is simple. First of all, Ethereum Classic (ETC) will benefit enormously from the Coinbase listing as the market recovers. Then there is the ETC Summit in September which will bring more attention to the project. The last time there was an ETC Summit, many considered Ethereum Classic (ETC) to be a dead coin or a scam just as it did Bitcoin (BTC) a while ago. Those of us who have been around for long know how sentiment changes in no time, particularly when a project goes the extra mile to prove its mettle. Just like Ethereum Classic (ETC) has done by proving that it is not only the orignial, decentralized, immutable and transparent Ethereum but it is also the future of the Internet of Things (IOT), a paradigm shift that will power the fourth industrial revolution.
