


We do not cover the uranium market often, but, admittedly, we cannot hide our excitement for this forgotten stock market segment. In fact, we have to apply our own 1/99 rule to control our emotions, which, for everyone including ourselves, is the top priority! Still, the bullish momentum that is brewing in this sector is so strong that it is a mystery to us how hardly anyone on this planet is reporting this. This is almost breaking news. We’ll show why, based on these 3 must-see charts that clearly visualize bullish momentum is brewing in uranium stocks.
As explained in our Uranium Forecast For 2018 published almost a year ago we identified two important things back then: first the bottoming and even basing pattern in uranium’s spot price, and secondly the seasonality that typically kicks in starting in October each year.
We’ll refer to both factors as we look at the 3 most important charts in the uranium sector, and explain why it is so important.
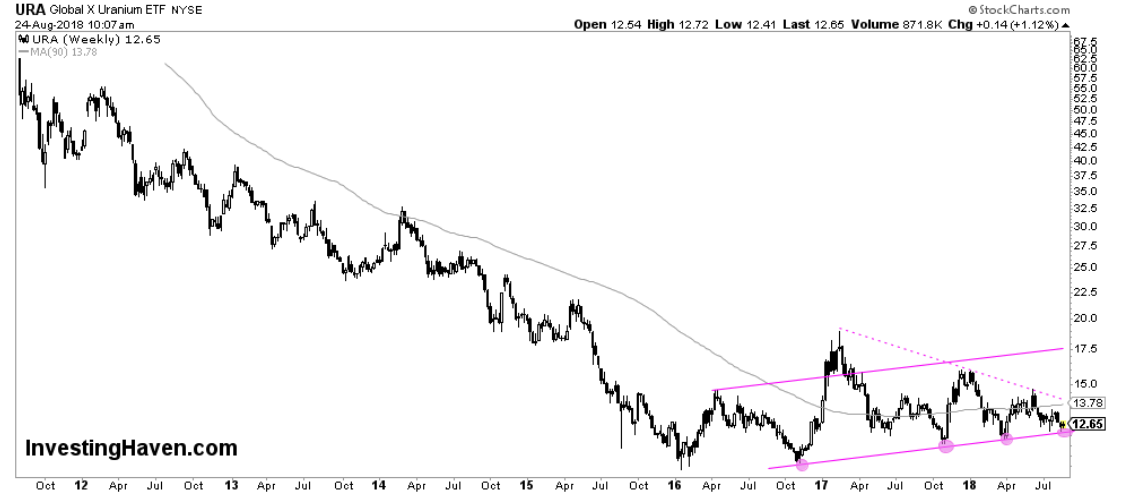
#1 Uranium sector shows bullish momentum
The uranium sector is represented by URA ETF. Its weekly chart going back to the top of the previous bull market, visualizing the whole bear market, is shown below. There is no doubt about this: bullish momentum is brewing, with a series of higher lows since January 2016.
This is a beautiful momentum setup that categorizes as *real* news.
Why did we bring up seasonality before? Because support is currently tested say 6 weeks before the strongest months of the year kick in (October till December).
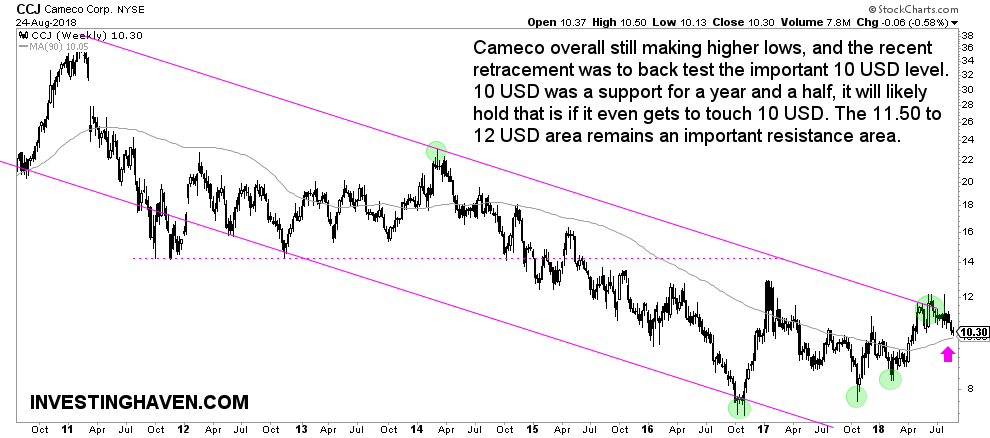
#2 Sector leader Cameco shows bullish momentum
The largest uranium pure play stock is Cameco, symbol CCJ. Its 7-year bear market is shown below.
Here, again, a clear bullish momentum setup is shaping up. Note how CCJ was attempting to break out twice in 2018, both in May and in July. However, so far, it categorizes as a failed breakout.
Moreover, what is happening now is that its long term bull market is finally pointing upwards (light gray line right above the purple arrow). This huge, and uranium stock bulls want to see CCJ trade above this line. Note how CCJ is now trading right in-between its bear market resistance at 11 USD and its rising bull market trendline at 10 USD. Yes, this area is so small that it is fair to conclude that bullish momentum is brewing in the uranium stock leader.
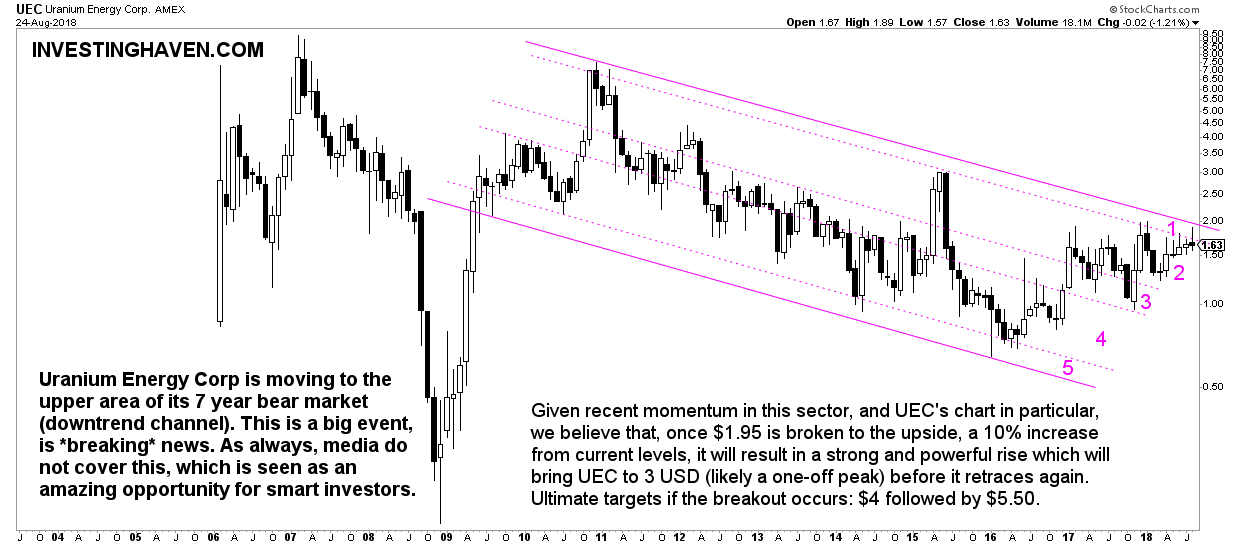
#3 UEC uranium stock darling moving to most bullish area
The most beautiful setup in the uranium stock sector clearly comes from UEC, our top pick in the sector.
Read here our Uranium Energy Corp Stock Forecast for 2018 (UEC).
In it we have outlined how UEC has moved to the upper area on its long term falling channel, a bullish signal to say the least. It has never spent more than a month in that area, since its 2011 peak.
Why is this so important?
Because the strongest months of the year are coming up. If, and that’s a big IF, uranium respects seasonality, we are likely to see 2 consecutive strong months, in which UEC will not only remain in area (1) on below chart, but most likely will break above it!
Momentum is building in UEC, our top favorite uranium stock, momentum is building in CCJ, the uranium stock leader, and momentum is building in the sector ETF. Likely smart investors are already taking positions in this sector?
Crypto market BREAKOUT: InvestingHaven flashed a BUY alert on July 18th 2018. Top notch guidance on how to play this breakout, tips on establishing a future proof crypto portfolio, our selection of 10 top cryptocurrencies and blockchain stocks. Go to our Blockchain Investing Service >>

