


InvestingHaven is on record calling for a higher gold price in 2018. In other words, the gold market bottom is already set in 2018, it was set on August 15th 2018. Guess what, on August 5th InvestingHaven published Gold Futures Market At Extremes, Suggests Gold Price Bottom Set For 2018. We are convinced the bottom of the gold price is set, this is why.
The gold bottom of 2018
The gold market bottom was set in August 2018. That may not be surprising for 2 very important reasons.
First, gold is typically weak in the summer. No wonder analysts tend to refer to the ‘summer doldrums’ continuously.
Second, and even more important, is the futures market setup. We provided coverage on this extensively, in recent weeks and months, especially in this piece written a month ago Gold Market Writing History In 2018:
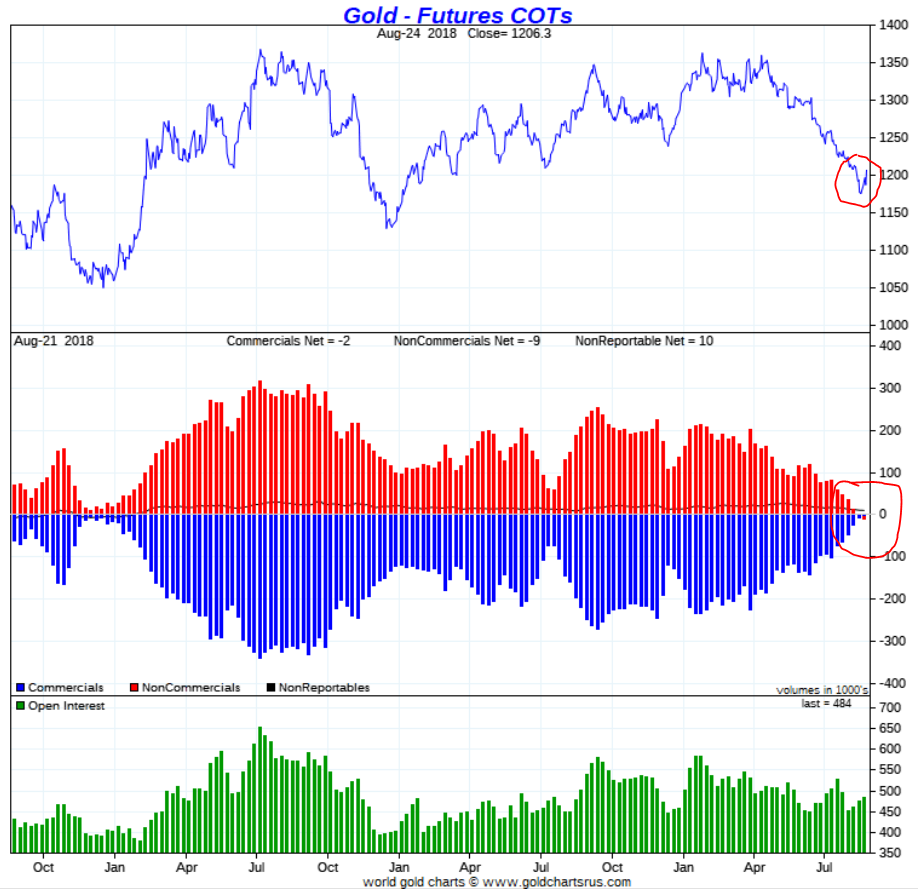
The point about the gold futures market is the positions of commercial and non-commercials market participants. Especially the non-commercials are at a record low level of net long positions. Going back almost 10 years in time, it is clear that a similar situation has only occurred only 4 times. With this week’s Commercial of Traders (COT in gold) gold futures report the extreme level has reached a only seen once before in the last 10 years: December 2015. That was before a monster rally, the mother of all short squeezes, took place, especially in silver stocks. If we check back historic data we see a similar situation as today only occurring once in 2002 and once in 2003.
Guess what, the situation has become worse in last week’s report which covers the period 14 till 21 August 2018 (there is almost one week of delay in the data that get published).
In other words, the gold price set on August 14th 2018, right at 1165 USD, is supposed to be the gold market bottom of 2018 because of the hardly ever seen before futures market positions.
Note the red circle on below chart.
Note that the 1200 USD to, ultimately, 1180 USD is the area we forecasted will be the ultimate and lowest area. We feel strongly this is as accurate as possible.
Higher gold price in 2018
So how does the gold price play out in 2018?
We refer to our piece written 2 months ago Gold Price: Short Term Bearish, Medium Term Strongly Bullish:
We prefer to look at gold’s long term chart which shows both the uptrend (until September 5th 2011) as well as the subsequent downtrend (until today included). The reason is that we look for specific patterns within a long term trend. Remember: the clearer the pattern the higher the probability of a forecast.
The most important insight, by far, that stands out on gold’s chart, is the long term cup-and-handle in the context of the ongoing bear market.
How far can the ongoing ‘handle’ bring the price of gold? According to us, and the generic rules of thumb with this setup, gold’s price may fall to the $1200 area (give or take a couple of percentages).
There you have it. At the risk of repeating ourselves we are going to repeat ourselves: a big cup-and-handle formation is ongoing in the gold market. The bottom of the ‘cup’ was set in December of 2015, the bottom of the ‘handle’ was set on August 15th 2018.
This is a huge consolidation pattern which, most likely, will mark the end of a rude 7-year bear market.
As said in our Gold Price Forecast For 2018 the gold bear market is making place for a new bull market. It may not be a repeat of the 2003 to 2008 amazing rise in the price of gold. However, a ‘normal’ bullish gold environment is a great thing, especially for the precious metals leveraged plays like silver, gold stocks, and silver stocks.
We believe now is the time to accumulate great gold and silver stocks as per our Bullish Gold Stocks Forecast for 2018.
Stay tuned as we are preparing our gold price forecast for 2019! We are sure gold bulls will love it, and it is an answer to some readers commenting on some sort of weird perma-bear stance they thought they had noticed on InvestingHaven in the past. Coincidentally, the price of gold has been declining or consolidating, which, as far as we understand markets, coincides with a bearish to neutral market condition.
However, if charts and market conditions show bullish market conditions, we notice this as well and do not hesitate to call it out, ideally forecasting it when the world is still bearish.
Crypto market BREAKOUT: InvestingHaven flashed a BUY alert on July 18th 2018. Top notch guidance on how to play this breakout, tips on establishing a future proof crypto portfolio, our selection of 10 top cryptocurrencies and blockchain stocks. Go to our Blockchain Investing Service >>

