


Bitcoin price has been on a rather pleasant run as of late and a move above the ascending channel would make this unexpected treat a little bit sweeter as a path towards $7,500 and above could open up.
Bitcoin Price Market Overview
This current rally has everyone feeling all bullish lately and even a small group of select altcoins are feeling the love. Question is, did BTC actually reach a bottom and reverse or is this just another one of those $1,000 green candle teases that eventually leads to a sharp reversal and revisit to prices below $6,000?
Let’s have a quick look at the charts to see where BTC 00 might go.
1-Hour Chart

Bitcoin price is confidently bullish for the short-term, though a move above the ascending trendline grows more urgent in order for BTC to maintain its current pace. BTC has pulled back from its daily high at $7,127 and appears to be consolidating from $7,000 to $7,100 which was to be expected as the RSI and Stoch spent most of the day bouncing around in overbought territory.
The 5-hour exponential moving average (EMA) has crossed below the 10-EMA and a drop below $7,000 would not be surprising as a mild pullback after rapid gains is typical.
In the event of a pullback, BTC is likely to rebound back to today’s range as the cryptocurrency remains in the ascending channel with the longer term moving average below as support. Furthermore, the RSI and Stoch have room to fall and accommodate a pullback to $6,875 before reversing course.
4-Hour Chart
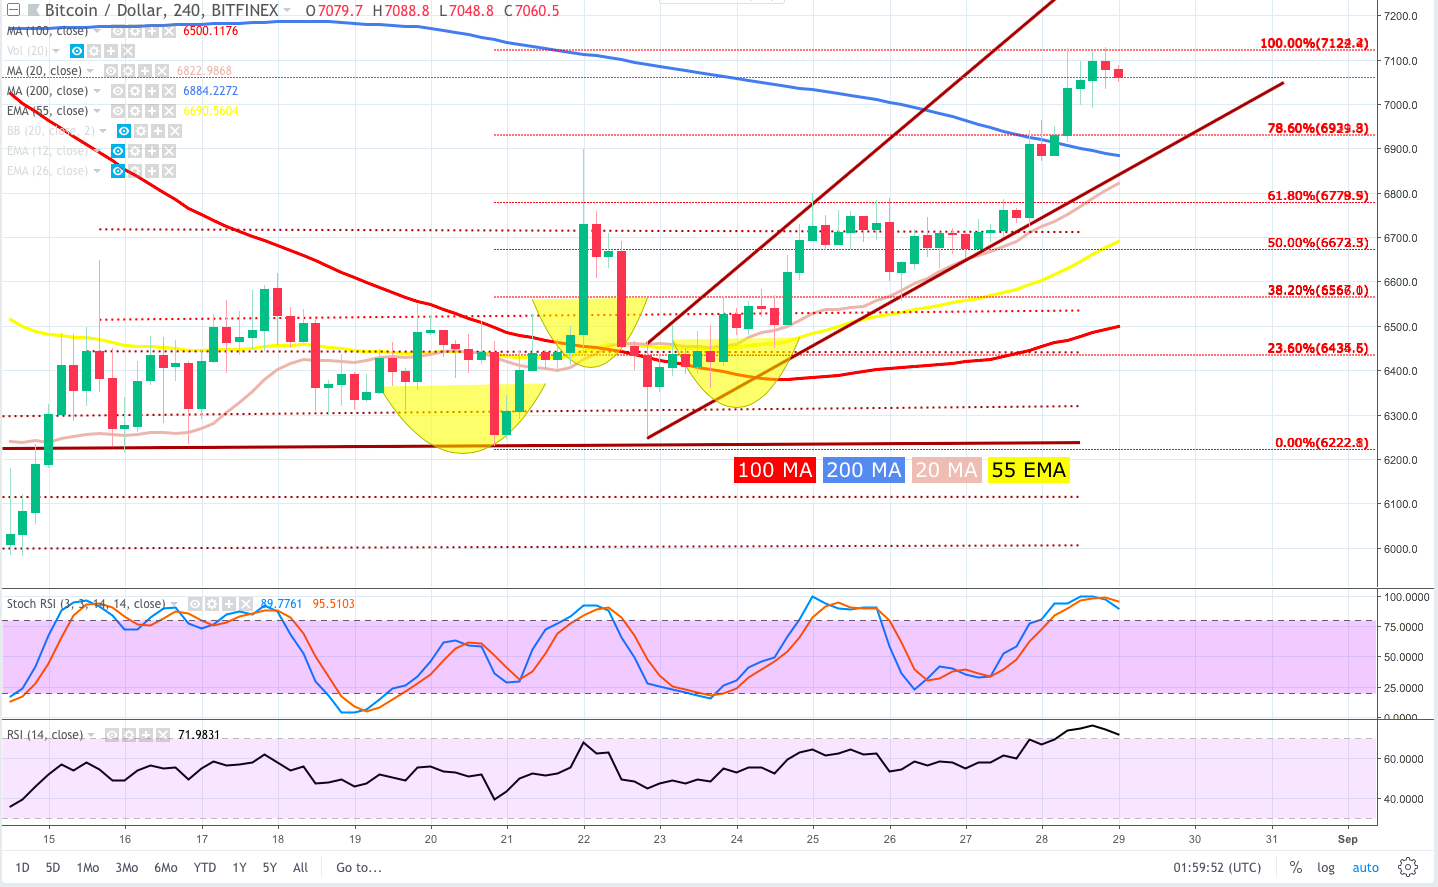
The recent upside move brought BTC 00 above the 200-day MA and the 20-MA is on the verge of crossing above the 200 MA while the 50 and 100-day MA have already crossed. Despite a slight pullback from today’s high ($7,127) BTC continues to consolidate within the ascending channel and while volume has tapered off BTC is well situated.
While the pattern of higher lows has fragmented, it is preserved on the daily chart and will remain so as long as the BTC stays above 6,568.
Looking Ahead
Barring a drop below the ascending trendline at $6,864, BTC could extend to the top of ascending trendline at $7,350 over the short-term.
A sharper pullback to $6,875 would not be surprising and bulls are likely to buy the dip in anticipation of a quick bounce back above $7,000.
BTC will encounter resistance at $7,128, $7,165 and $7,490. In the event of a reversal, BTC will find support at $6,877, $6,711 and $6,566. BTC has spent the day bouncing off softer supports at $7,000, $7,030 and $7,050.
[Disclaimer: The views expressed in this article are not intended as investment advice. Market data is provided by BITFINEX. The charts for analysis are provided by TradingView.]
Where do you think Bitcoin price will go? Let us know in the comments below!
Images courtesy of Shutterstock, Tradingview.com.
