


As Bitcoin price approaches the Monthly candle close after a volatile day yesterday, we take a look at what’s going on in the market.
4 Hour Chart
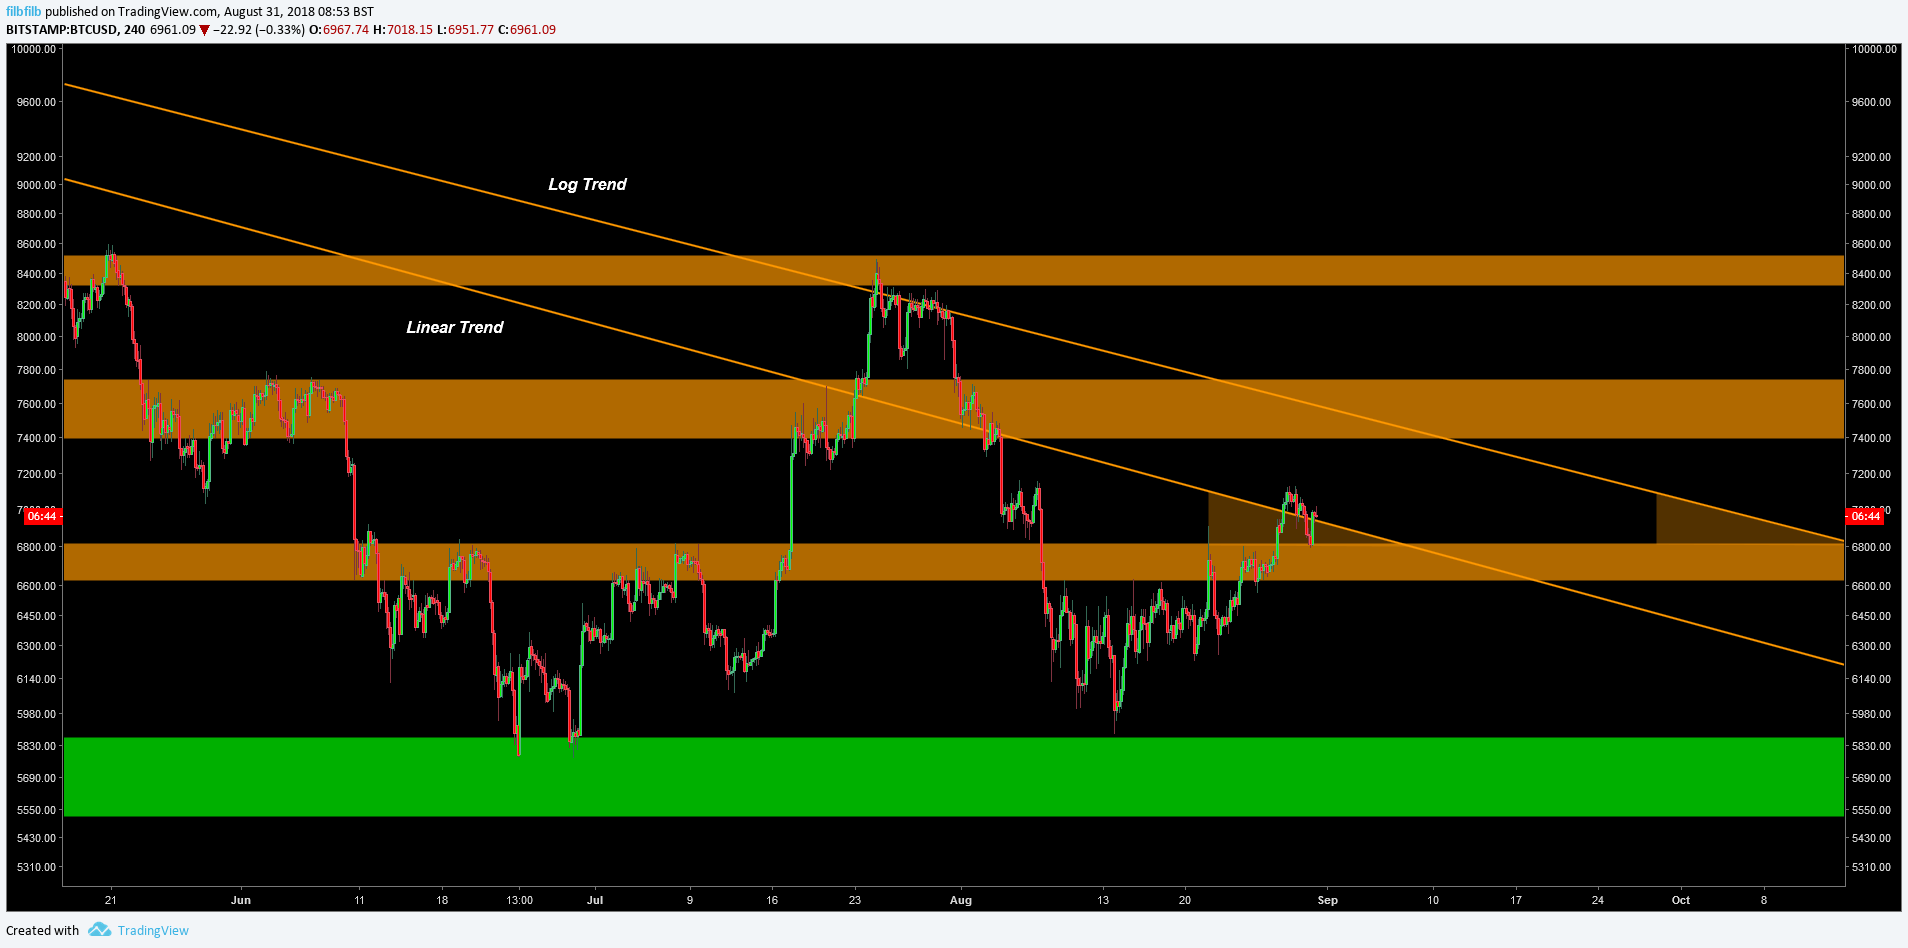
Looking that the daily chart, after closing the previous week at $6,700, Bitcoin 00 began a bullish start to the week, trading at highs of $7,125 breaking the linear resistance by Tuesday.
Volatile moves followed on Thursday with Bitcoin dropping back to retest the previous resistance of $6,800 where support was found and a sharp $200 move back up to $7,000. Some traders will view resistance turning into support [otherwise known as a Wyckoff Throwback], as being bullish after a period of accumulation.
Despite the bullish move, c.5,000 short contracts were closed at Bitfinex during the $6,800 retest, meaning the margin long positions now outweigh the shorts, limiting the ability for the bulls to trigger a short squeeze in the stretch to test $7,500. The close out of the shorts may represent the market being more convinced of a floor at $6,000.
CME Futures Close
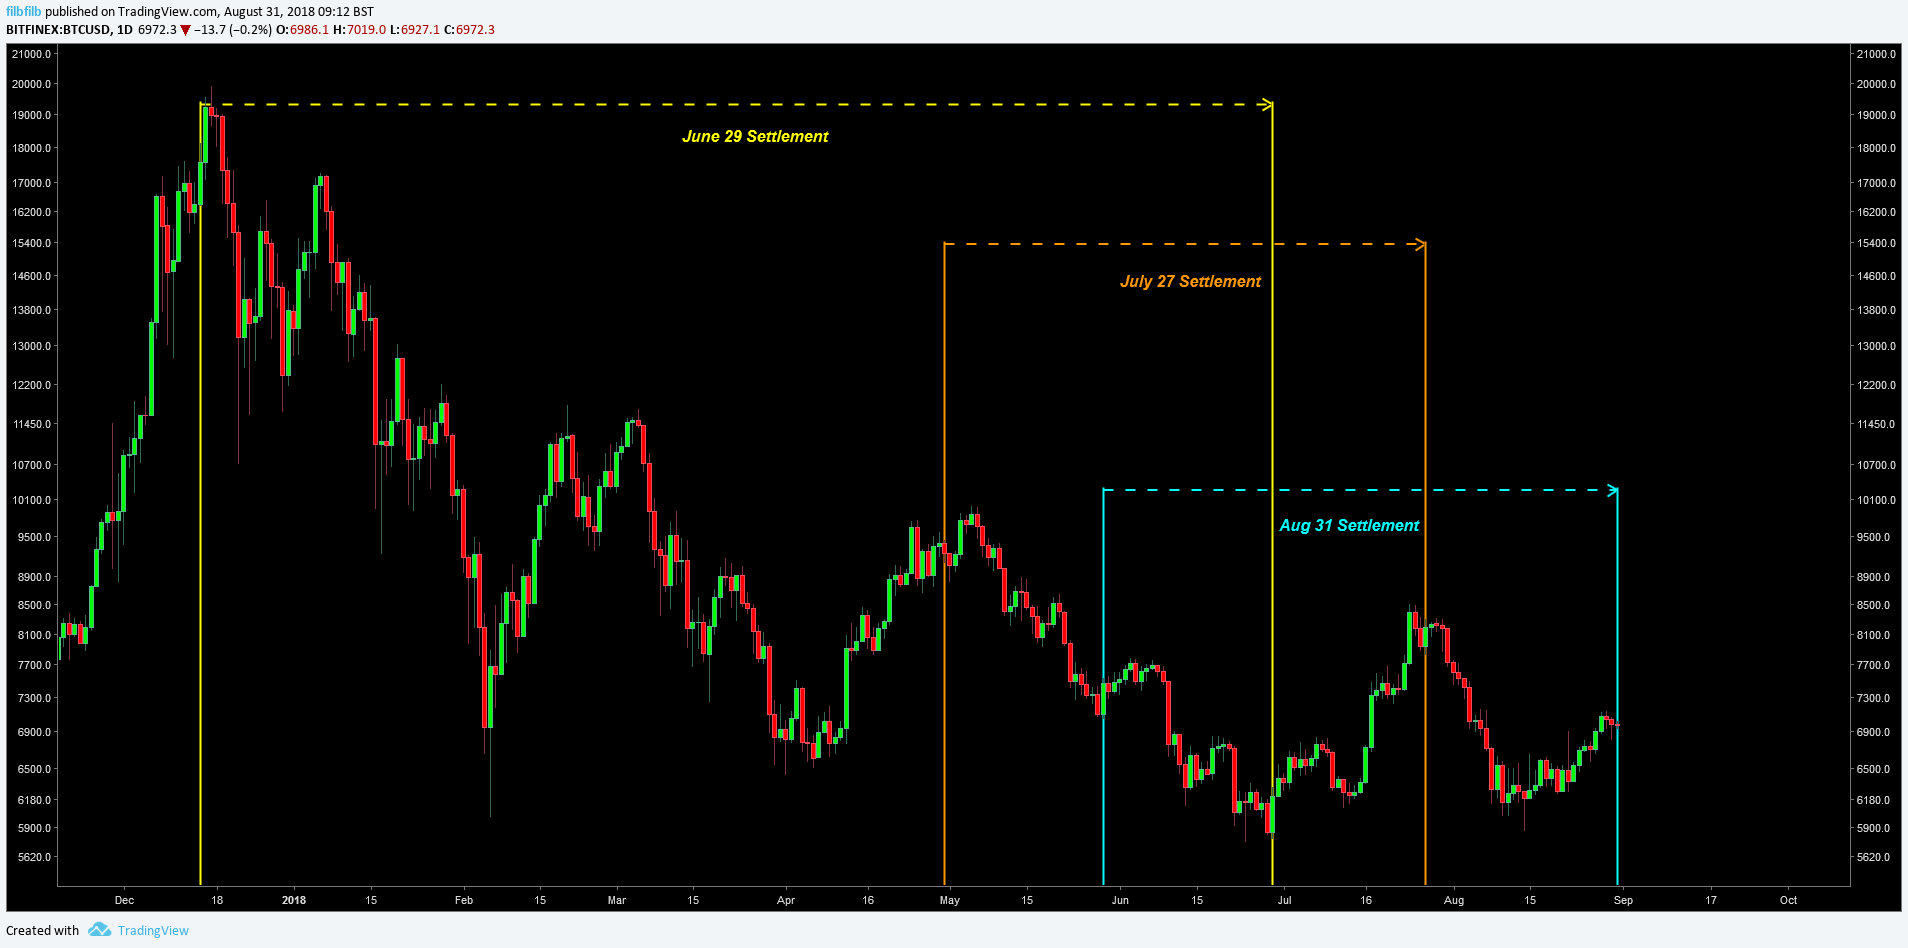
Friday can often be volatile in the markets with many Traders closing positions for the week.
The 31st of August also marks the settlement of the CME futures contract; the two previous of which have previously seemingly marked tops and bottoms in the bear market as has been highlighted by several commentators. Despite the relatively low volume, many will be expecting added volatility around the August monthly close out.
Monthly Chart
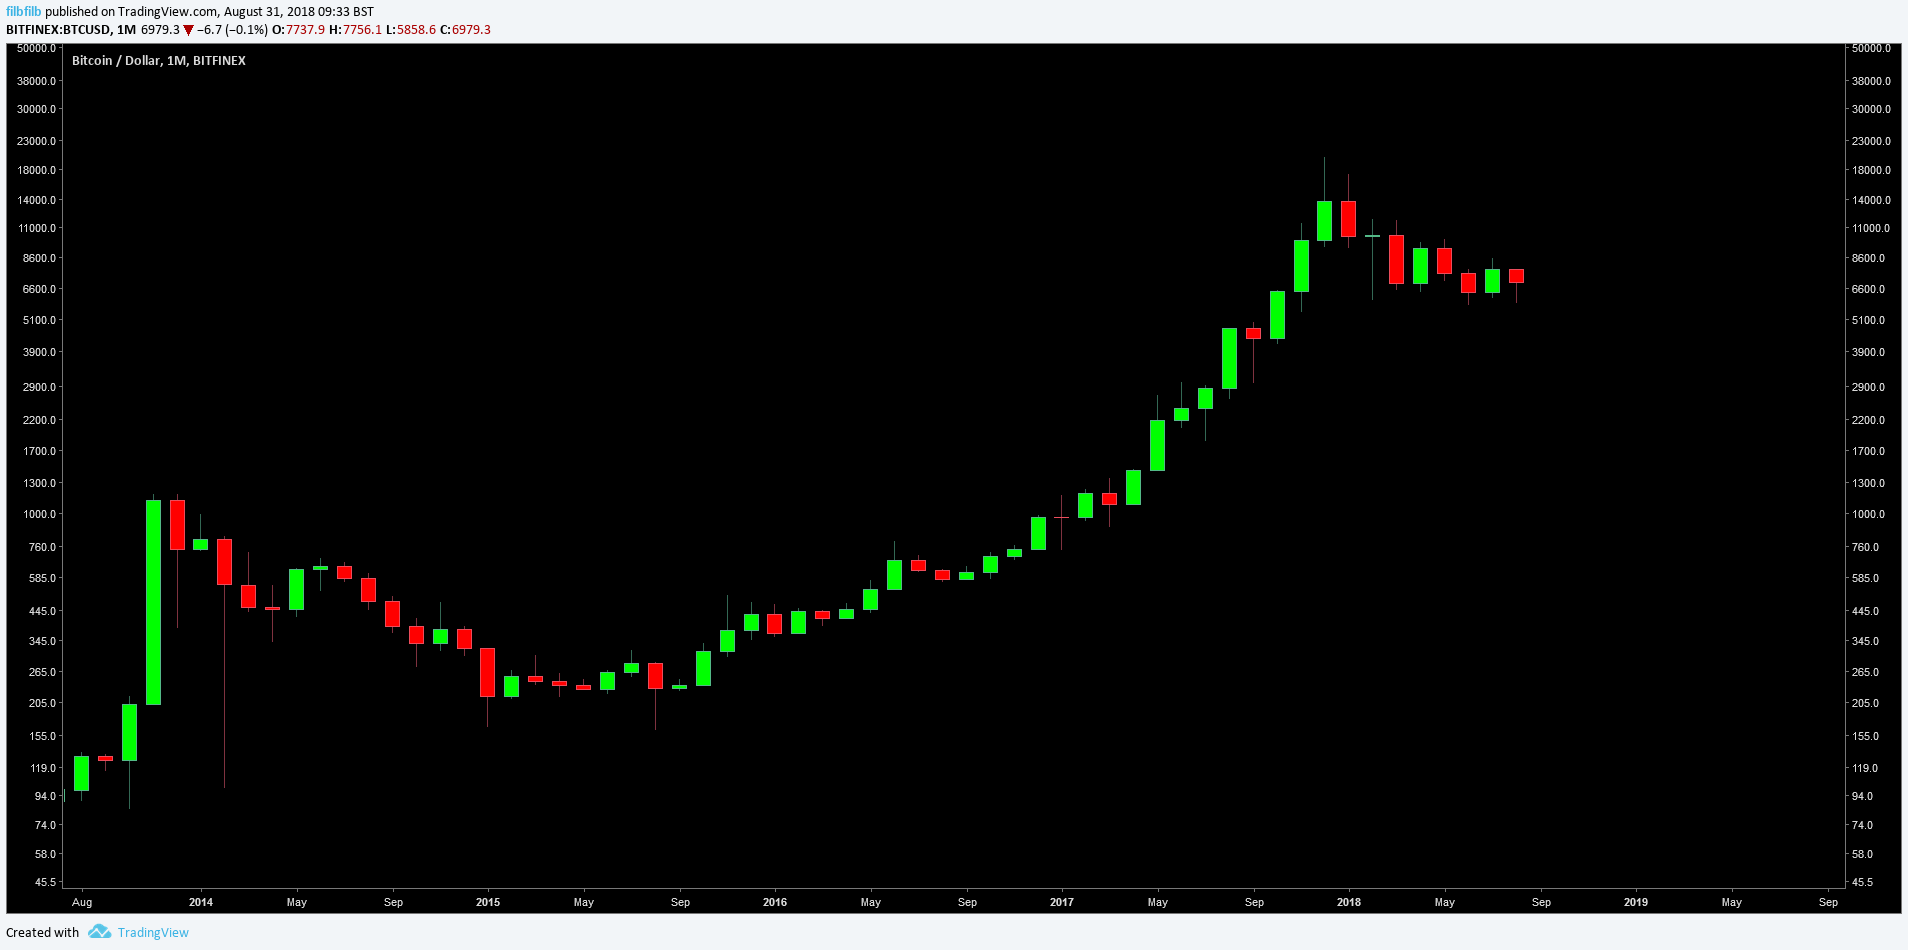
Bitcoin opened the month at $7,750 and subsequently traded almost 25% lower at $5,850.
Despite 2018 being a bear market until higher highs are found and held at $8,500, a close above $6,800 would be positive for the bulls.
Despite the bear market over the past 8 months, there are some early signs of bitcoin trying to find a bottom on the weekly chart and the overall long-term trend for bitcoin clearly remains bullish.
Bitcoin price 00 closed August 2017 at $4,700; some 32% lower than today’s prices, along way below the yearly support for bitcoin. In the medium term, the bears will continue to build short positions at previous levels of resistance with a view to retest support around $6,000 ultimately targeting $5,000.
[Disclaimer: The views expressed in this article are not intended as investment advice. Market data is provided by BITSTAMP and BITFINEX. The charts for analysis are provided by TradingView.]
Where is Bitcoin price going this week? Share your predictions below!
Images courtesy of Shutterstock, Tradingview.com
