


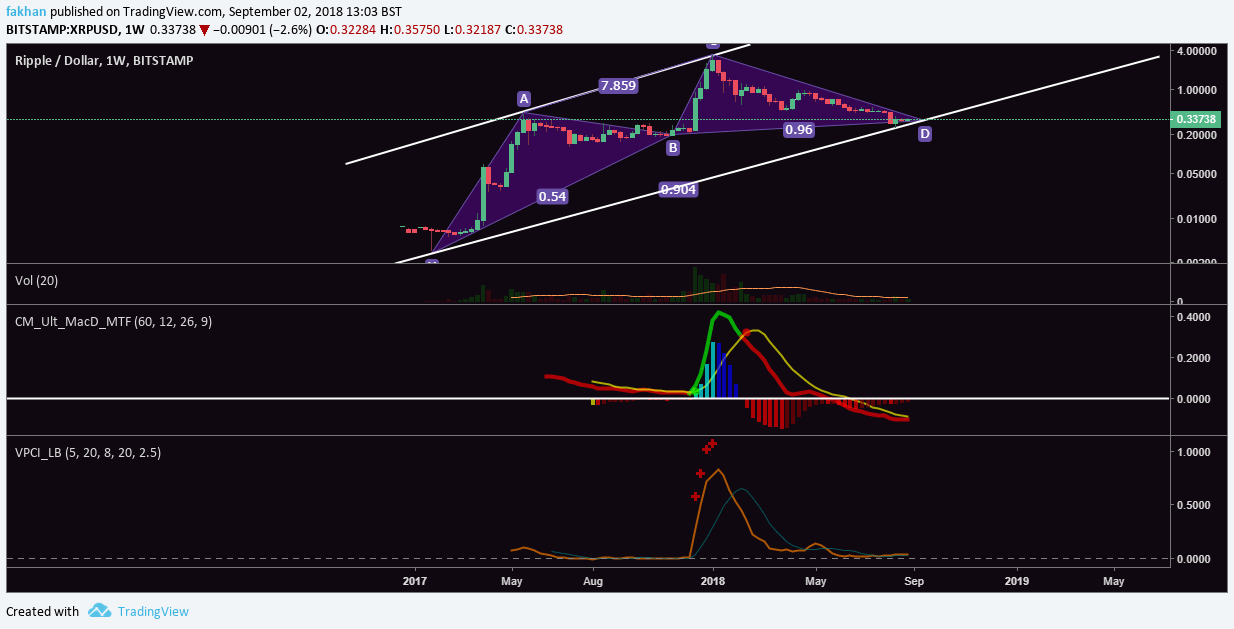
Ripple (XRP) is about to begin a new trend. The weekly chart for XRP/USD shows that this could be as soon as next week when Ripple (XRP) forms a new candle outside the bullish gartley formation on the XRP/USD chart. Volume price confirmation indicator for XRP/USD shows the new trend has already started. MACD diagram for the above chart shows that the correction has run its course and Ripple (XRP) is ready to begin a new trend from here. Volume has also been declining steadily and has now reached a point where a break out is expected.
The question is not whether Ripple (XRP) will begin a new trend anytime soon. The chart shows quite clearly that Ripple (XRP) has found a bottom and that a new trend is about to begin. The real question is whether Ripple (XRP) will be able to make similar gains as it has in the past. This question has become even more importantly in light of a recent statement from Satis Group which stated that Bitcoin (BTC) is going to $96,000 and Ripple (XRP) is going to $0.01 by 2023. In all fairness, that is quite a bold pronouncement and it is too premature to say which cryptocurrency is going where by 2023. As long as XRP has a use case, its price is likely to appreciate. Ripple (XRP) capitalized on the idea of dominating the forex market which drove the price of XRP to astronomical levels. After that, the price had an equally aggressive correction. This is why, currently, Ripple (XRP) appears to be one of the best cryptocurrency investments from a risk/reward standpoint. However, the question as to whether Ripple (XRP) will be able to make similar gains still remains unanswered.
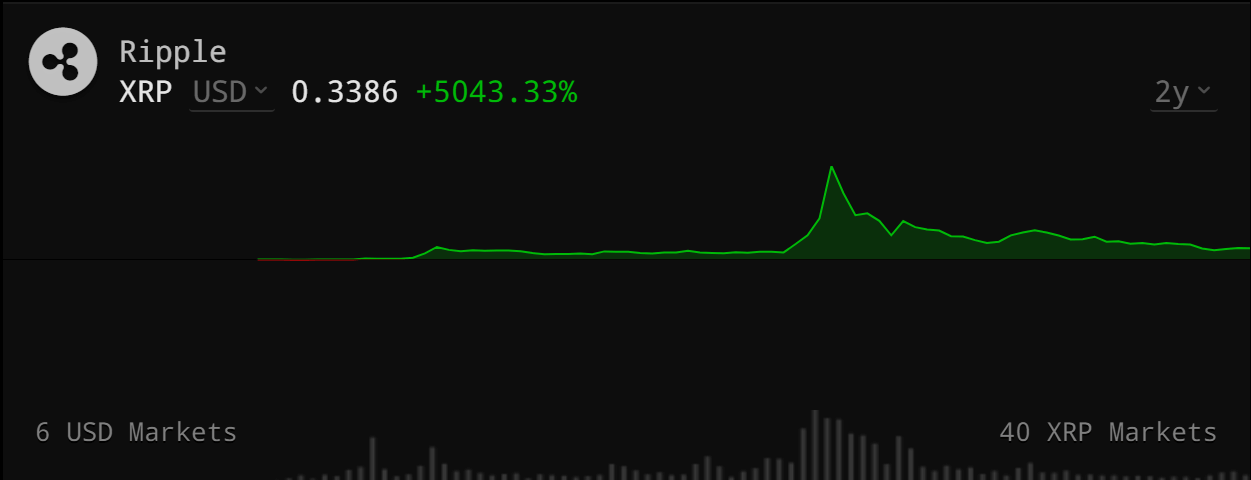
Ripple (XRP) is up 5043% for the last two years, making it one of the best performing coins. The price of Ripple (XRP) currently trades at $0.34 but the new cycle has not begun yet. If Ripple (XRP) were to follow the same trajectory as before, we can expect to see the price of a single XRP coin valued at $15 or higher in 2019. This would put the market cap of Ripple (XRP) close to $600 billion. This does appear to be a long shot when put this way, but it is still possible if Ripple (XRP) succeeds in having even a small number of banks use XRP instead of their nostro accounts.
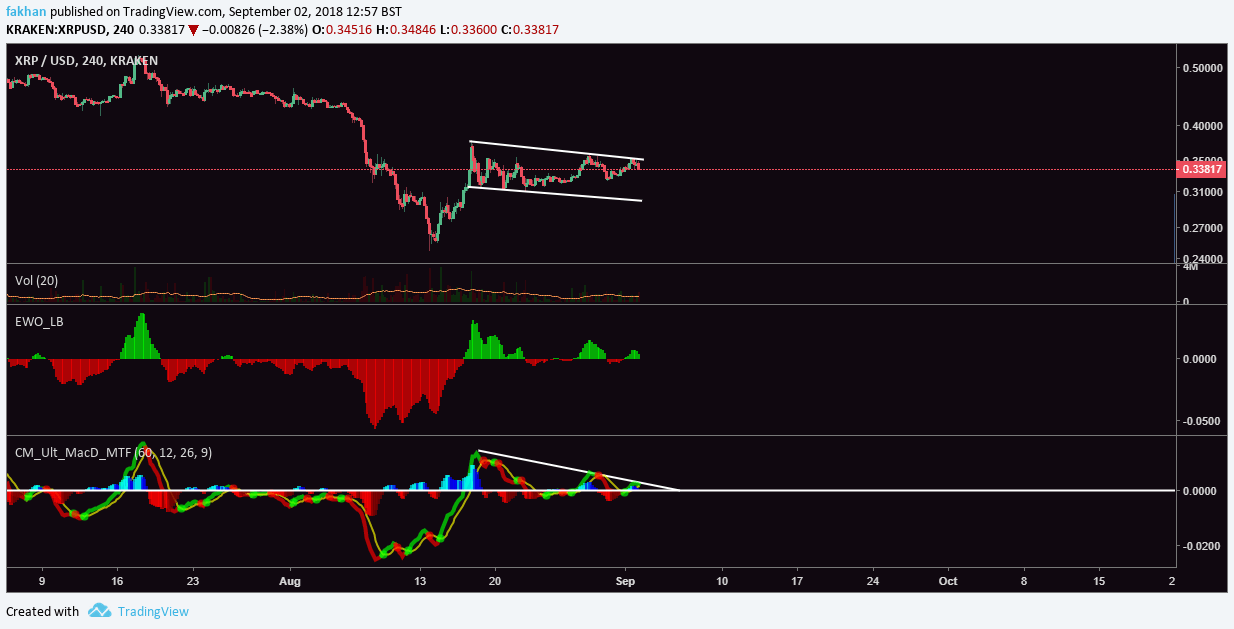
Ripple (XRP) seems to be forming a major bull flag on the 4H time frame shown on the above chart. This bull flag stands between Ripple (XRP)’s correction and the beginning of a new cycle. Most technical indicators for Ripple (XRP) point to a major rally that might surpass its previous all time high. Of course making 20x or higher gains will be a challenge at this big of a market cap, but then again as we have seen in the past blockchain projects like Ripple (XRP) have a lot of potential and if they succeed in securing even a small portion of the trillion dollars forex market, the price of XRP will increase astronomically.
