


The bitcoin price on Monday appreciated versus the US Dollar, boosted by passable buying sentiment near $6,121, July 13 low.
The BTC/USD today rose as much as 3.67 percent since establishing its intraday low at 6149-fiat. The pair started the trading session attempting a weak rebound from yesterday’s 100-dollar fall. The Asian morning saw BTC/USD forming higher highs towards 6372-fiat. However, the pair recorded a downside correction as the Europe session picked momentum, dropping towards 6255-fiat. And now, at the beginning of US trading hours, BTC/USD looks to be in a bias conflict.
The overall correction sentiment is to the upside. 6121-fiat historically has been proven a strong influencer to the July’s rally towards 8500-fiat. So, we could expect BTC/USD to hold itself above the said level and still retain its upside dreams in near-term.
BTC/USD Technical Analysis
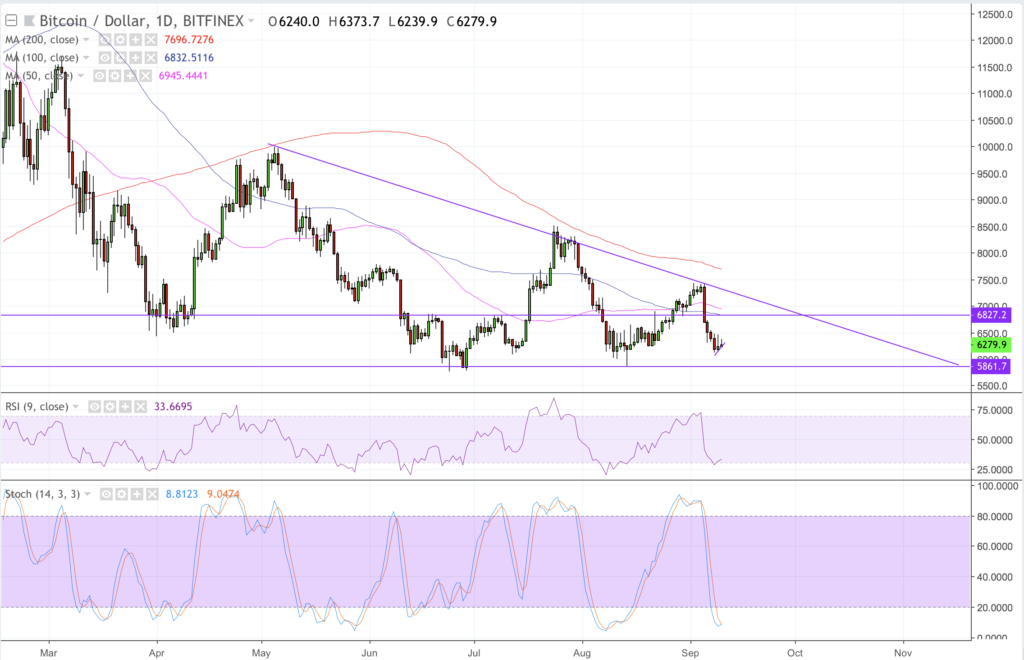
The BTC/USD in long-term is inside a giant descending triangle, with its base support near the Bitcoin’s 2018-bottom near 5861-fiat. It wouldn’t surprise if the pair extends its prevailing bearish momentum and restest the lower trendline support. A potential rebound from any support at this point could also have BTC/USD test the channel resistance in medium-term. Overall, the pair seems to be locked inside it, awaiting breakdown/breakout.
The bias sentiment is more inclined towards bears. BTC/USD is already trending below its 50-, 100- and 200-H moving averages. The head of the 50H MA is also looking to crawl below its 100H MA, which indicates a medium-term bearish action in the market. The RSI and Stochastic indicators are also inside strong selling sentiment areas, awaiting an upside rebound.
BTC/USD Intraday Analysis
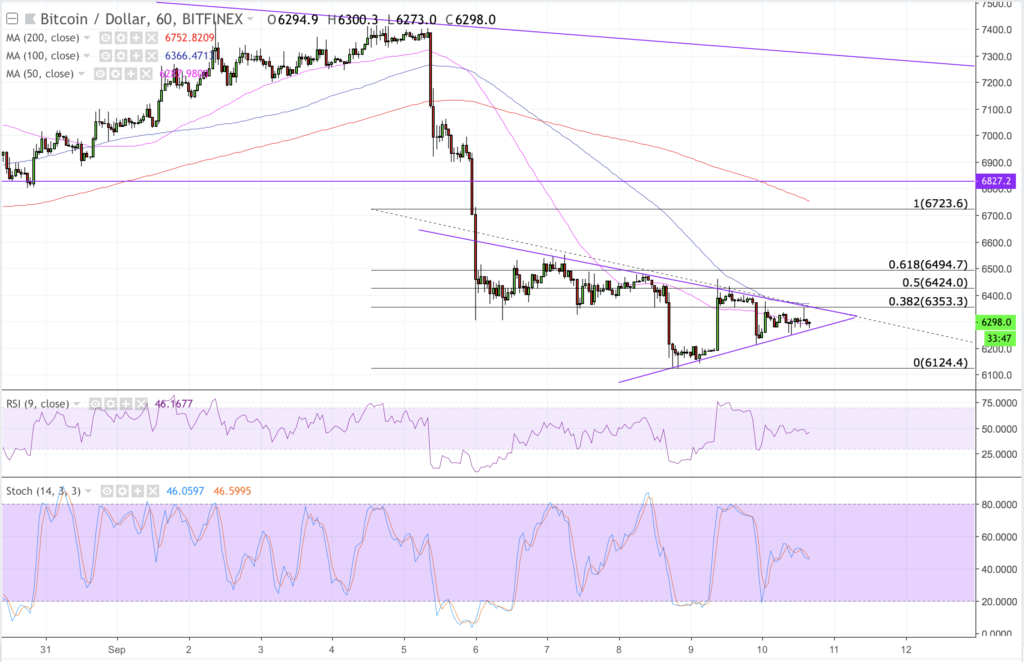
We are forming a symmetric triangle on hourly BTC/USD chart. The stiff sideways action is enabling us to follow a wait-and-watch approach until there is a definite breakout/breakdown to indicate the trend for the rest of the day. In simple words, if BTC/USD breaks above the channel resistance, we will be putting our long positions towards the upside targets. And if BTC/USD breaks below the channel support, we will be putting our short positions towards the downside targets.
On that note, let’s discuss our intraday strategy of the day.
The range we are looking for today is defined by 6353-fiat as interim resistance 6210-fiat as interim support. If price extends its near-term bullish recovery, we will be waiting for a break above the said resistance before putting our long position towards 6424-fiat, our primary upside target. In this position, a stop two-pips below the entry point will be enough to protect us from volatile trend reversals.
Looking the other way, a break below the triangle channel support will have us put a short towards 6210-fiat. If support is also broken, then we will enter a quick short towards 6124-fiat, September’s low. In this position, a stop loss 4-pips above the entry point will define our risk perspective well.
Featured image from Shutterstock. Charts from TradingView.
Follow us on Telegram or subscribe to our newsletter here.
• Join CCN’s crypto community for $9.99 per month, click here.
• Want exclusive analysis and crypto insights from Hacked.com? Click here.
• Open Positions at CCN: Full Time and Part Time Journalists Wanted.
