


TC/USD
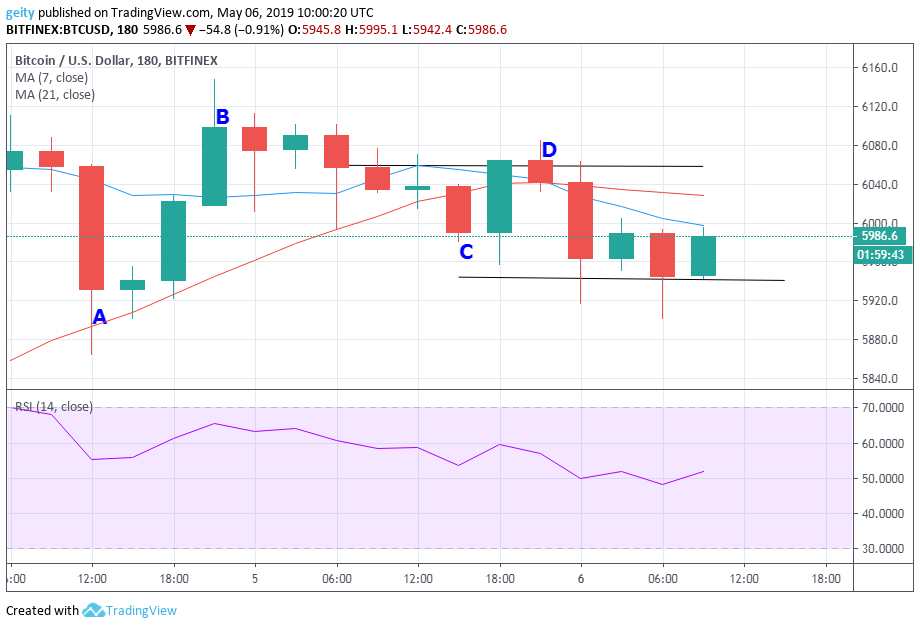
Sideways trend is observed in the last 24hrs.
A bearish market rally was seen at the beginning of the day (A) when sellers overpowered buyers. But later on, due to the emergence of a reversal pattern, an uptrend followed where the price rose from $5668 to $5799 (A to B) then it pulled back down to (C) $5719.
The resistant level is at $5800 and the support level is seen to be at $5700.
On 5th may, the 7-day moving average crossed over 21-day moving average (D) indicating the end of the previous trend.
BTC FORECAST
The 7 day MA has crossed over the 21 day MA indicating a bullish momentum in the coming few hours while the RSI is pointing north, this signals an uptrend, therefore, all the indicators confirm an uptrend. Traders can go long if the price bounces from support ($5700) and take a short position if it pulls back from resistance ($5800)
ETH/USD
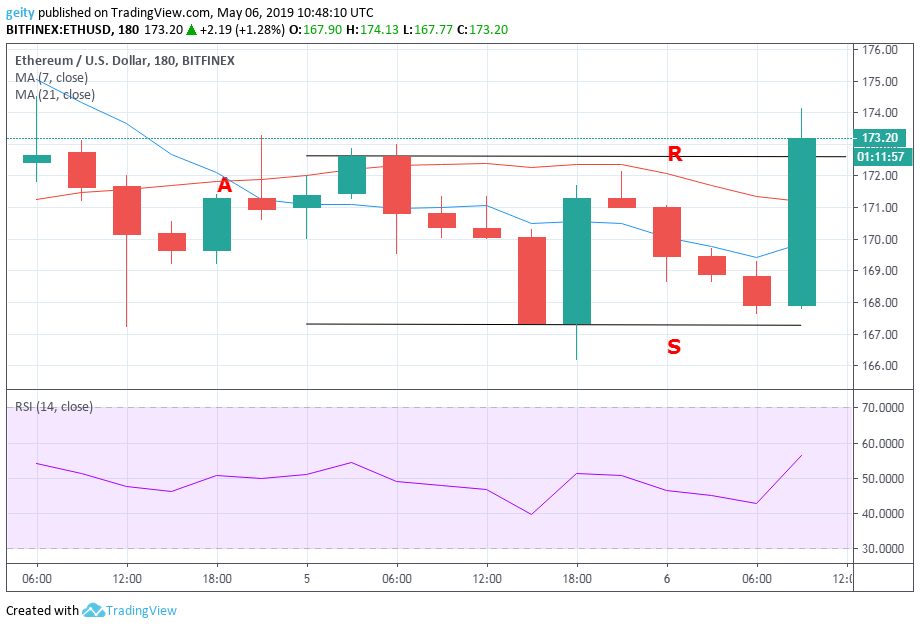
Unlike BTC/USD, Ethereum has a bullish outlook, is up by 7.62% in the last 24hrs. In spite of it beginning the day with a bearish outlook it still managed to increase price momentum to a high of $174 from a low of $167.
At around 04 May, the 21-day moving average crossover the 7-day moving average (A) indicating a reversal. The price slightly pulled up but later on, a bearish rally followed making the support level the perfect area to go long.
After a short while the price bounces back up to close at $171.30 and then an immediate decline of price momentum was encountered at 167.90. But later on, at the end of the day, the buyers pulled the price up to close at $174.
ETH FORECAST
During the last hours, there was a consolidation of prices. The 21 day MA is also above the 7-day MA. This may signify that the sellers hold sway, thus we expect a dip in price in the short term with our targets being at $164.
XRP/USD
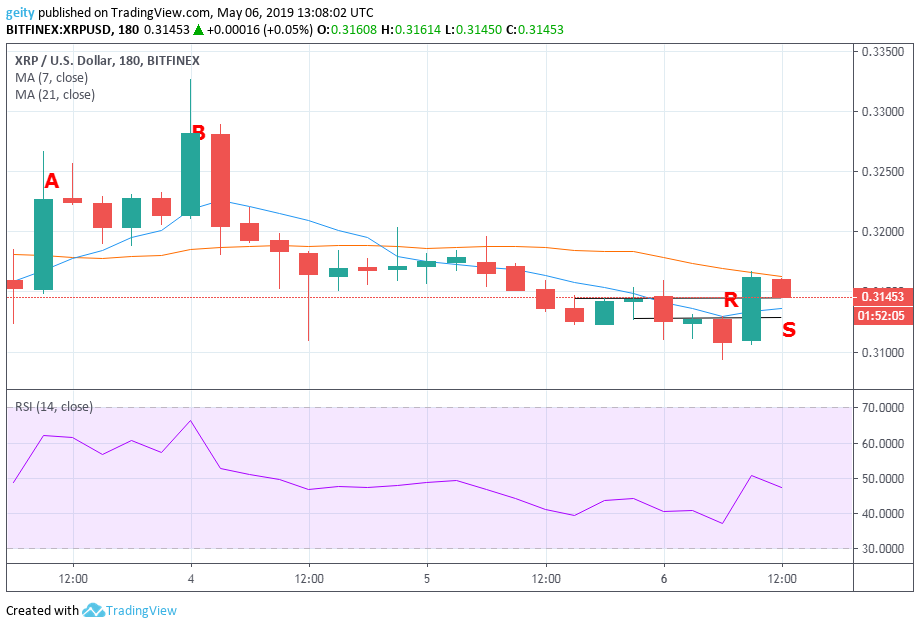
A positive price movement is seen at the beginning of the day (A), later on, there was indecision, finally, buyers managed to push the price up. However, the sellers pulled it to its previous levels and ultimately managed to dip it to $0.31.
Consolidation followed as the next price momentum was sought. This then resulted in support levels being broken and the price went further south. The resistant level is currently set at $0.31 and the support level at $0.30.
XRP FORECAST
The 21-day moving average crossover 7-day moving average indicating a bearish trend. The RSI is headed south which show a downtrend in the market in the coming days. Traders can go short, the next price target expected at $0.3129.
Author: Dennis Wafula
Read more at: https://zycrypto.com/bitcoin-btc-ethereum-eth-and-xrp-price-analysis-and-forecast/


