


- Bitcoin Cash on Tuesday late in the session is trading in minor negative, nursing losses of just 0.10%.
- BCH/USD price action breached a near-term ascending trend line, but buyers protect $400 mark.
- The daily chart view can see the price moving within a bullish flag structure.
Spot rate: 417.69
Relative change: -0.10%
High: 428.89
Low: 410.61
BCH/USD
| Overview | |
|---|---|
| Today last price | 417.7201 |
| Today Daily Change | 0.0061 |
| Today Daily Change % | 0.00 |
| Today daily open | 417.714 |
| Trends | |
|---|---|
| Daily SMA20 | 431.3246 |
| Daily SMA50 | 420.5694 |
| Daily SMA100 | 357.0866 |
| Daily SMA200 | 248.3095 |
| Levels | |
|---|---|
| Previous Daily High | 420.4 |
| Previous Daily Low | 406.0993 |
| Previous Weekly High | 449.2051 |
| Previous Weekly Low | 380.4645 |
| Previous Monthly High | 516.9074 |
| Previous Monthly Low | 362.9877 |
| Daily Fibonacci 38.2% | 414.9371 |
| Daily Fibonacci 61.8% | 411.5622 |
| Daily Pivot Point S1 | 409.0756 |
| Daily Pivot Point S2 | 400.4371 |
| Daily Pivot Point S3 | 394.7748 |
| Daily Pivot Point R1 | 423.3763 |
| Daily Pivot Point R2 | 429.0385 |
| Daily Pivot Point R3 | 437.677 |
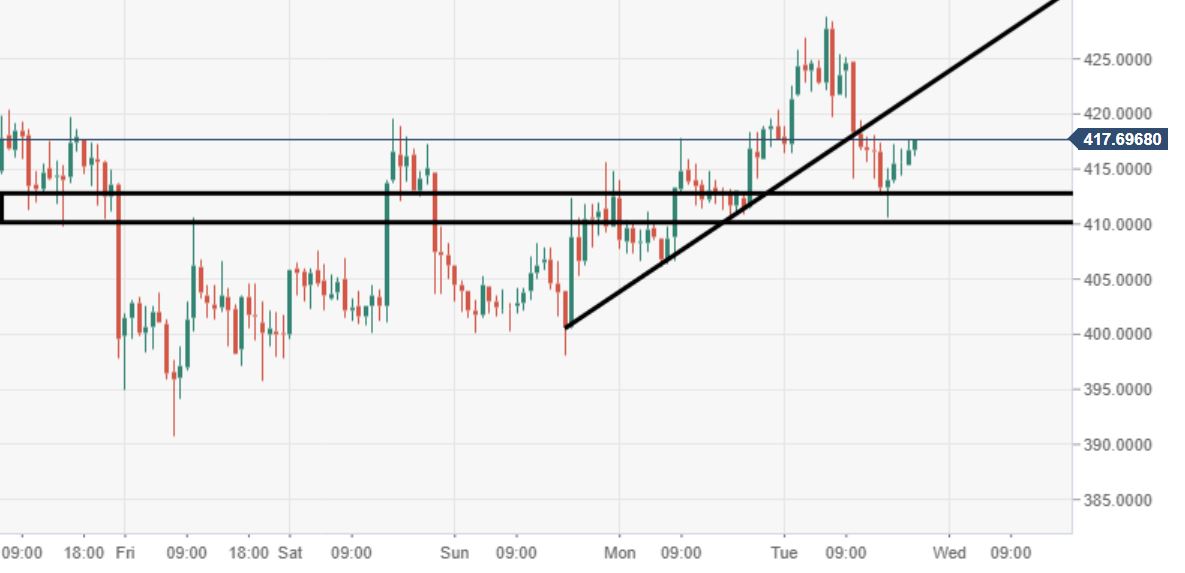
BCH/USD 60-minute chart
- 60-minute chart view saw a breakout of a near-term ascending trend line, price caught by buyers at $400 territory.
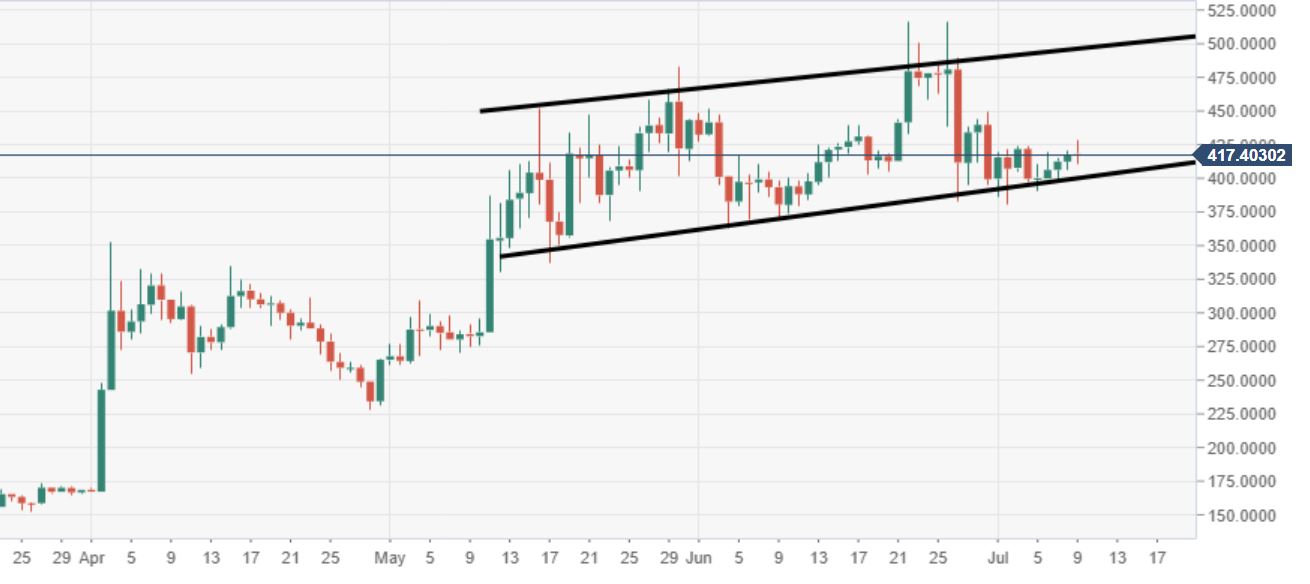
BCH/USD daily chart
- Price action via the daily continues to move within the confinements of a bullish flag, subject to a potential breakout.


