


- Ethereum price is trading in the grene by 2.35% in the session on Thursday.
- ETH/USD bulls pressing to break down the heavy supply range, $175-190.
- The upside pressure is resuming following the commence higher on Wednesday.
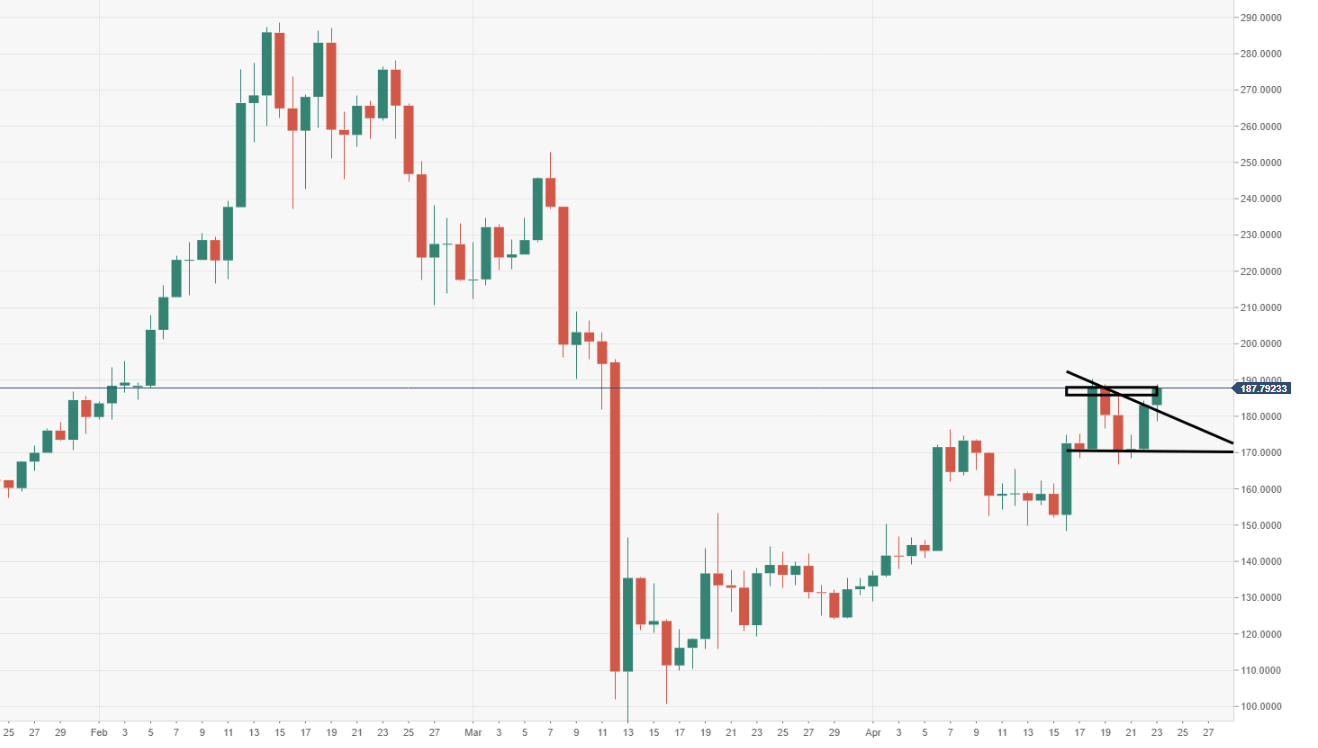
ETH/USD daily chart
Supply remains heavy from the range of $175 up to $190, ahead of the $200 retest.
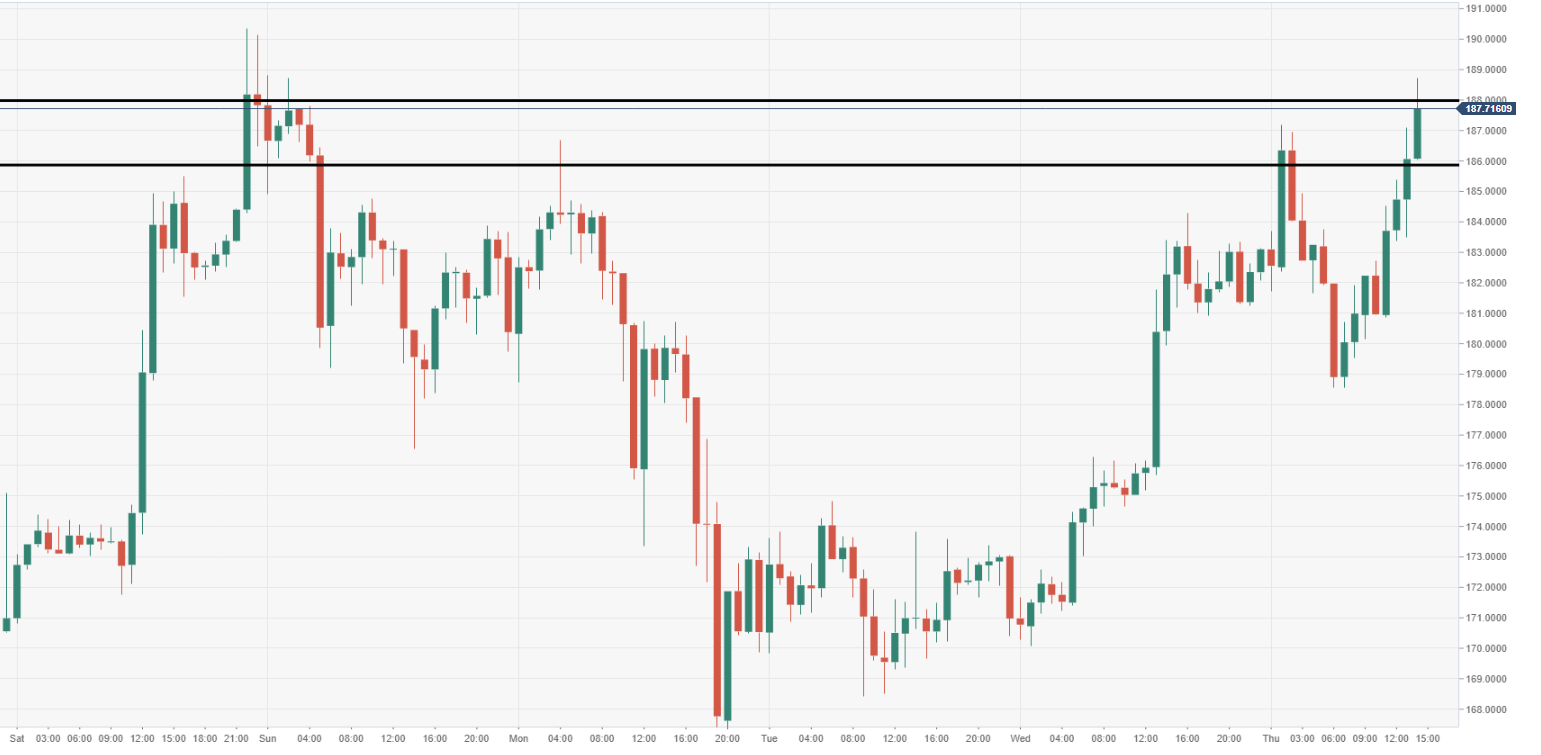
ETH/USD 60-minute chart
The bulls smashed through a critical hourly resistance zone, $185-187.
Spot rate: 153.38
Relative change: +2.35%
High: 188.73
Low: 178.55
ETH/USD
| Overview | |
|---|---|
| Today last price | 186.06 |
| Today Daily Change | 2.96 |
| Today Daily Change % | 1.62 |
| Today daily open | 183.1 |
| Trends | |
|---|---|
| Daily SMA20 | 164.42 |
| Daily SMA50 | 157.34 |
| Daily SMA100 | 185.14 |
| Daily SMA200 | 172.23 |
| Levels | |
|---|---|
| Previous Daily High | 184.29 |
| Previous Daily Low | 170.07 |
| Previous Weekly High | 175.11 |
| Previous Weekly Low | 148.3 |
| Previous Monthly High | 252.76 |
| Previous Monthly Low | 89.65 |
| Daily Fibonacci 38.2% | 178.85 |
| Daily Fibonacci 61.8% | 175.5 |
| Daily Pivot Point S1 | 174.02 |
| Daily Pivot Point S2 | 164.94 |
| Daily Pivot Point S3 | 159.8 |
| Daily Pivot Point R1 | 188.23 |
| Daily Pivot Point R2 | 193.37 |
| Daily Pivot Point R3 | 202.45 |
Author: Ken Chigbo


