


- Bitcoin has been struggling on Monday after another failed attempt to break higher levels.
- BTC/USD is currently finding support at the 55 EMA which is doing the job for now.
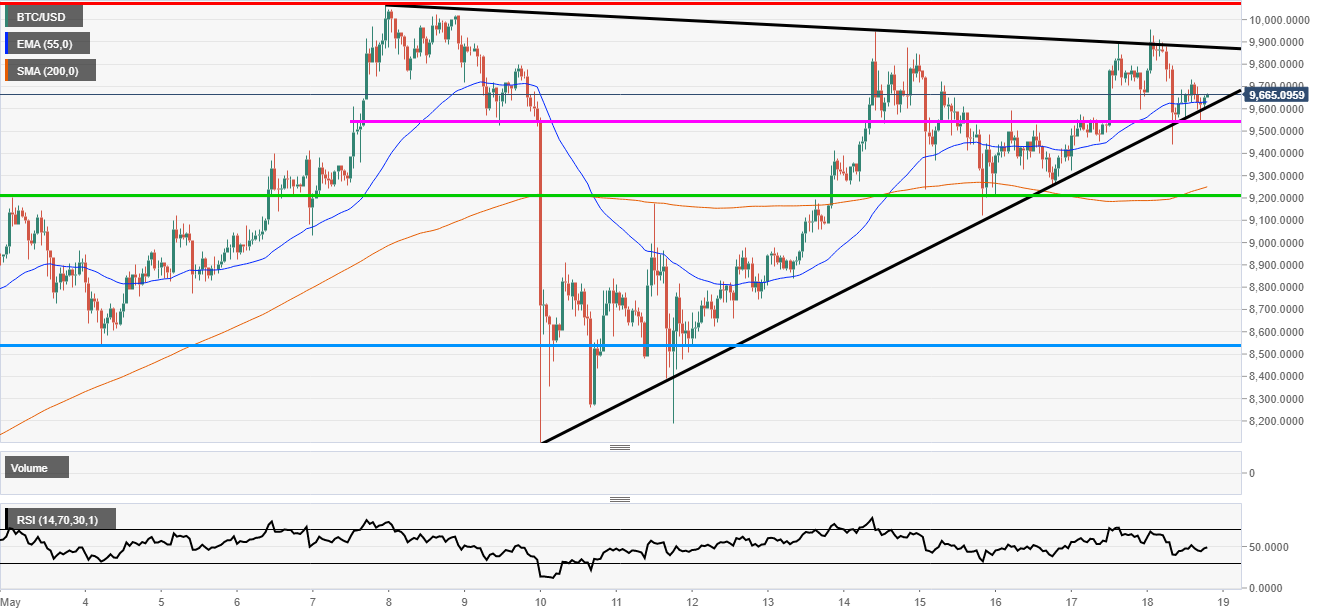
BTC/USD 1-hour chart
Bitcoin has had another go a breaking through the 10K mark earlier on in the session but once again failed. The only good news for the bulls is the fact that the purple support zone just above 9600 seems to be holding firm.
The aforementioned level also confluences with the 55 hourly exponential moving average (EMA). This could give the zone more gravitas when trying to hold off the bears. Elsewhere, the Relative Strength Index (RSI) indicator languishes at the mid-line lacking any clear direction.
It feels like this the bulls could be given another opportunity but if there is any failure the bears will take hold of the market and the support zones could be tested. The next major support level is the green horizontal line at 9200. That level is closer to the 200 simple moving average and would be interesting to see what happens there.
Additional levels
BTC/USD
| Overview | |
|---|---|
| Today last price | 9652.82 |
| Today Daily Change | -19.71 |
| Today Daily Change % | -0.20 |
| Today daily open | 9672.53 |
| Trends | |
|---|---|
| Daily SMA20 | 9096.19 |
| Daily SMA50 | 7842.88 |
| Daily SMA100 | 7997.17 |
| Daily SMA200 | 8050.39 |
| Levels | |
|---|---|
| Previous Daily High | 9893.74 |
| Previous Daily Low | 9324.75 |
| Previous Weekly High | 9944.79 |
| Previous Weekly Low | 8105.58 |
| Previous Monthly High | 9476.83 |
| Previous Monthly Low | 6156.67 |
| Daily Fibonacci 38.2% | 9676.39 |
| Daily Fibonacci 61.8% | 9542.1 |
| Daily Pivot Point S1 | 9366.93 |
| Daily Pivot Point S2 | 9061.34 |
| Daily Pivot Point S3 | 8797.94 |
| Daily Pivot Point R1 | 9935.93 |
| Daily Pivot Point R2 | 10199.34 |
| Daily Pivot Point R3 | 10504.93 |
Author: Rajan Dhall, MSTA


