


Precious metals moved 11.52% higher in Q2.
Silver leads the way on the upside with a better than 30% gain for the quarter.
Gold continues to march higher with an over 13% price increase from Q1.
Platinum recovers by over 16%.
Palladium corrects lower, but the price was still just below $2000 per ounce.
Cryptocurrencies also moved higher in Q2.
The precious metals sector of the commodities market posted a gain over the second quarter of 2020 despite a loss in palladium. Rhodium edged a bit lower, but silver, gold, and platinum all posted double-digit percentage gains. The move higher in the sector tuned a loss in Q1 into a gain at the end of the first six months of 2020 in the sector.
The composite of the four precious metals that trade on the COMEX and NYMEX divisions of the CME exploded 28.93% higher in 2019. In Q1 2020, the sector declined by 5.44%. In Q2, it gained 11.52% and was 2.81% higher over the first six months of this year.
In Q1, the outbreak of coronavirus and the upcoming US election caused volatility in markets across all asset classes. During the final week of February, risk-off conditions caused central banks around the world to ease, which continued to support the price of gold. In March, the US central bank lowered the Fed Funds rate to zero percent and launched bazookas of liquidity in the form of quantitative easing into the financial system. Throughout Q2, the Fed unleashed an unprecedented quantitative easing program that included both government and corporate debt issues. The US Treasury borrowed $530 billion from June through September 2008 in the aftermath of the global financial crisis. In May 2020, the Treasury borrowed $3 trillion, and more borrowing is likely on the horizon over the coming months. Double-digit unemployment in the US and outbreaks of the virus have taken a toll on the economy as businesses and individuals alike continue to suffer.
Global interest rates are at record low levels. The ECB followed the Fed with liquidity injections to stabilize markets as the virus took a high toll on members of the EU. US President Trump favors negative interest rates for the US, but so far, the Fed has rejected the notion. However, future shutdowns of the economy could force the hand of the central bank now that shot-term rates are at zero percent.
The dollar index rose to the highest level since 2002 when it reached 103.96 on the back of risk-off behavior in markets that caused buying in the US currency. Since late March, the dollar index has been moving lower as the yield differential no long supports a strong greenback versus the euro. The euro is the primary currency in the dollar index, with an almost 60% exposure.
The “phase one” trade deal between the US and China brought a return of optimism to markets in Q4, but that quickly ended as Coronavirus was the next issue facing China and the world. The world remains a volatile place, which promises to continue to provide support for some of the members of the precious metals sector in Q3 and beyond.
In the US, former Vice President Joe Biden is the nominee for the Democrats. The 2020 Presidential contest has the potential to be the most contentious in history, given the current environment in the United States. Meanwhile, coronavirus has taken a significant toll on the US as it leads the world in cases and fatalities.
In 2019, the prices of most digital currencies rebounded. In Q1 2020, many of the cryptocurrencies posted losses, but there were some gains. In Q2, the digital currency asset class posted gains, which could be a function of dovish central bank policies that weigh on the value of fiat currencies like the dollar, euro, and other legal tenders around the globe. Central banks can print currencies to their heart’s content in the current environment. Digital currencies are an alternative to traditional foreign exchange instruments as they operate independently from central banks, governments, and monetary authorities. As faith in governments and central banks decline, the cryptocurrencies become more attractive.
Precious metals are moving into Q3 after impressive gains in silver, platinum, and gold in Q2. Gold moved to new record levels in almost all world currencies except for the US dollar during 2019 and the first half of 2020. At the $1800 level, the yellow metal is closing in on the 2011 peak at $1920.70 per ounce. The Aberdeen Standard Physical Precious Metals Basket Shares ETF product (GLTR) holds a diversified basket of physical positions in gold, silver, platinum, and palladium.
Gold Review
Gold was 18.87% higher in 2019. In Q1, the precious metal continued to march higher as it gained 3.96%. In Q2, it moved 13.71% higher and was 18.21% above the price at the end of 2019. Gold traded in a range between $1450.90 and $1804.00 over the first half of 2020 and settled on June 30 near the peak at $1800.50 per ounce. The dollar index fell by 1.76% in Q2 but was 1.35% higher over the first six months of this year. Gold’s rise continues to be a testament to its overall strength considering the rising dollar since the end of last year.
Gold has not only been moving higher in dollar terms but also in euro and yen currency terms, which is the sign of a bull market in the precious metal.
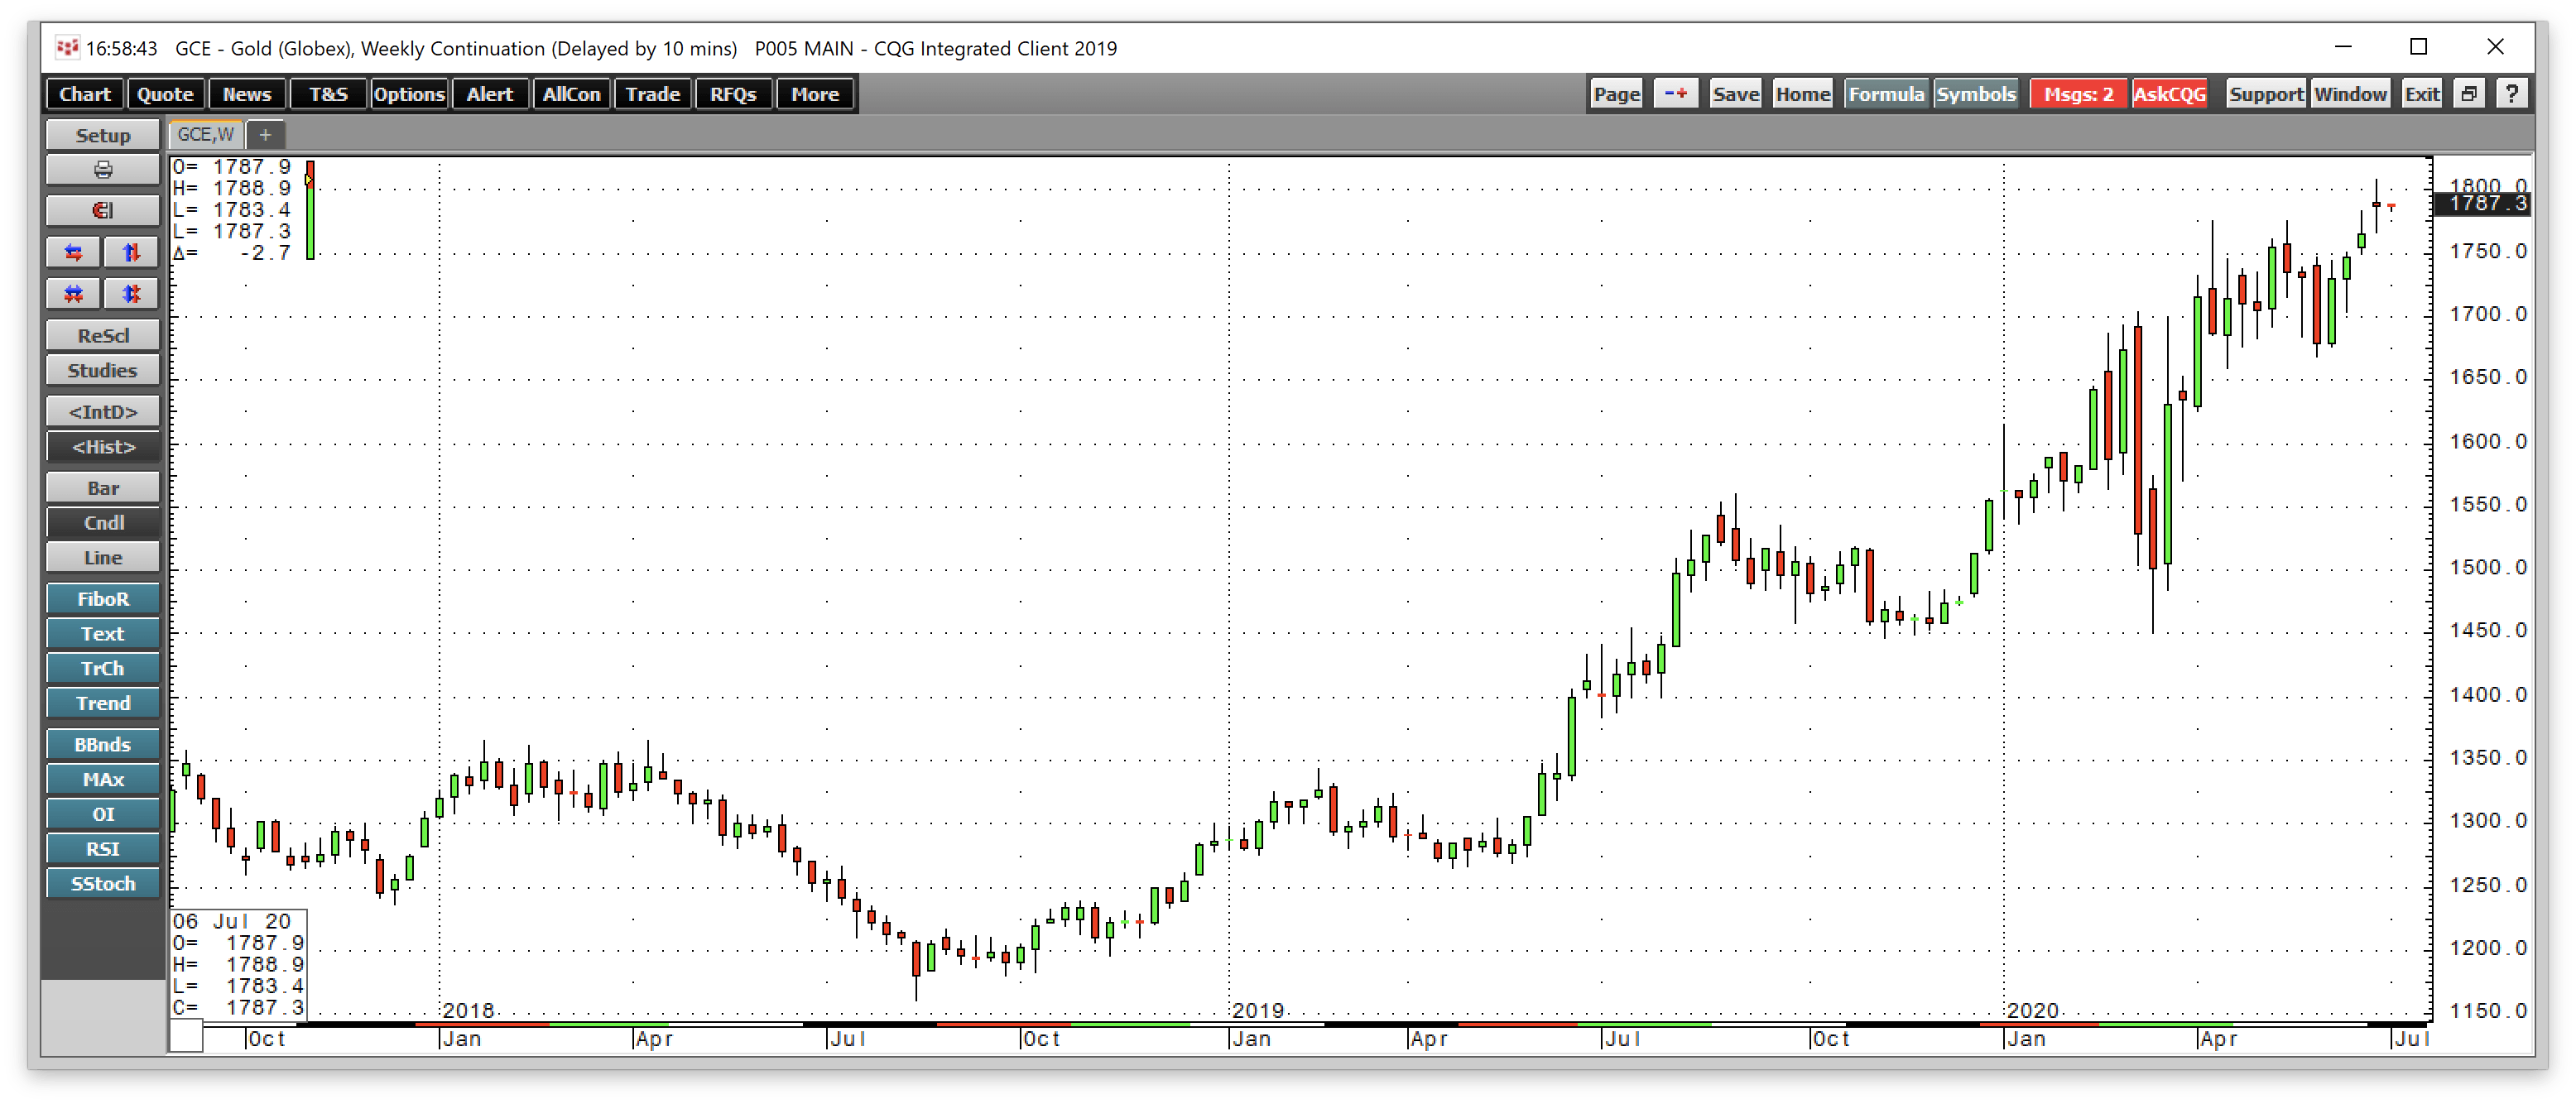
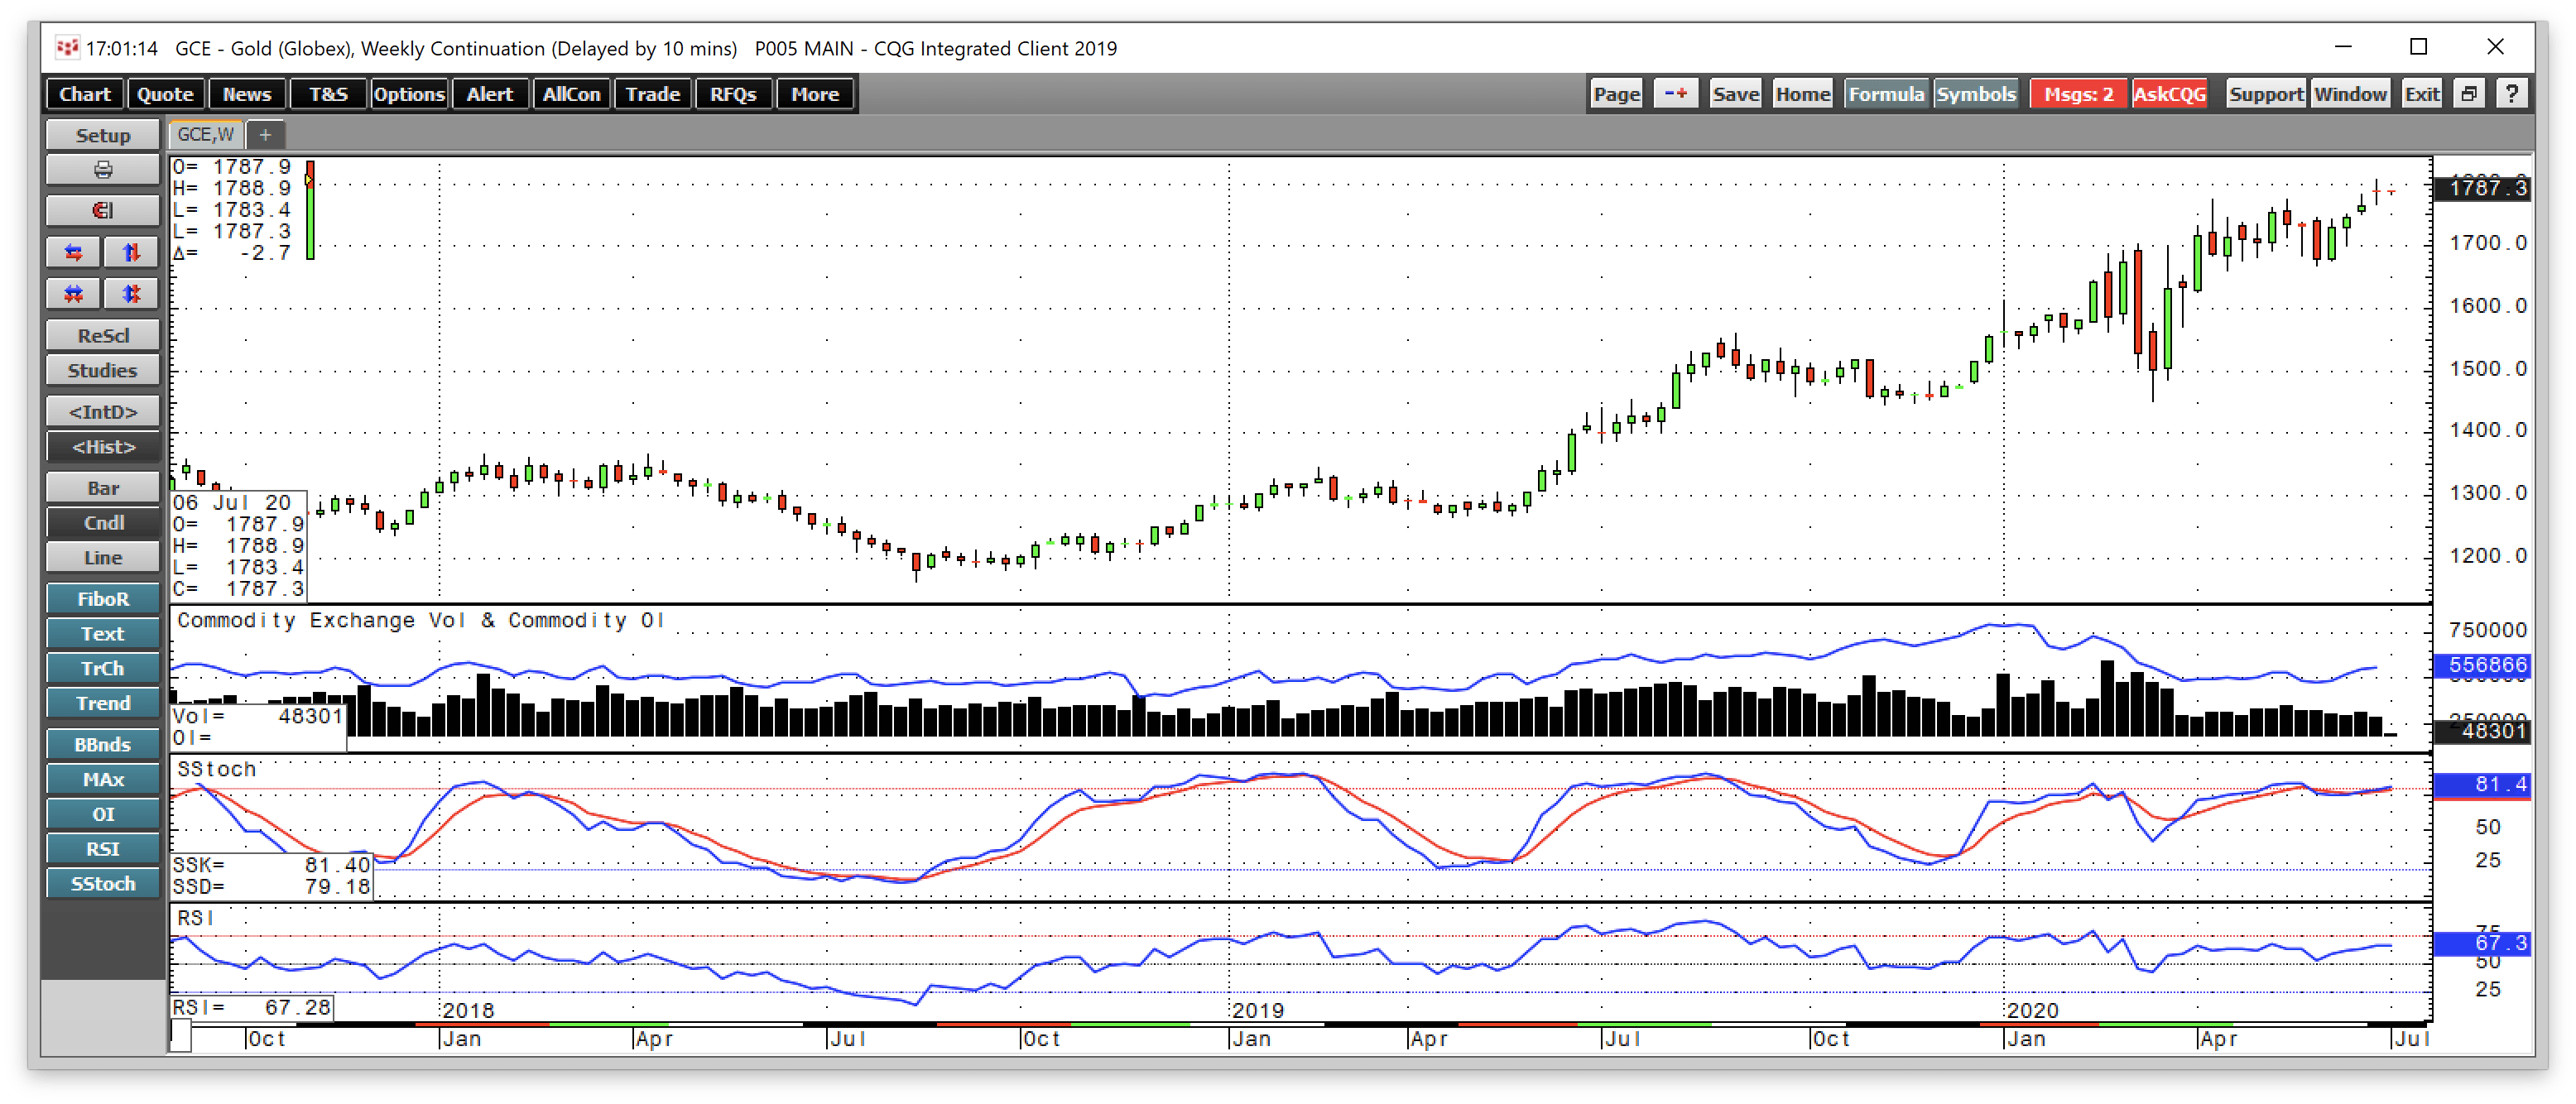
Source: CQG
The weekly chart shows that gold has been moving higher in dollar terms since August 2018.
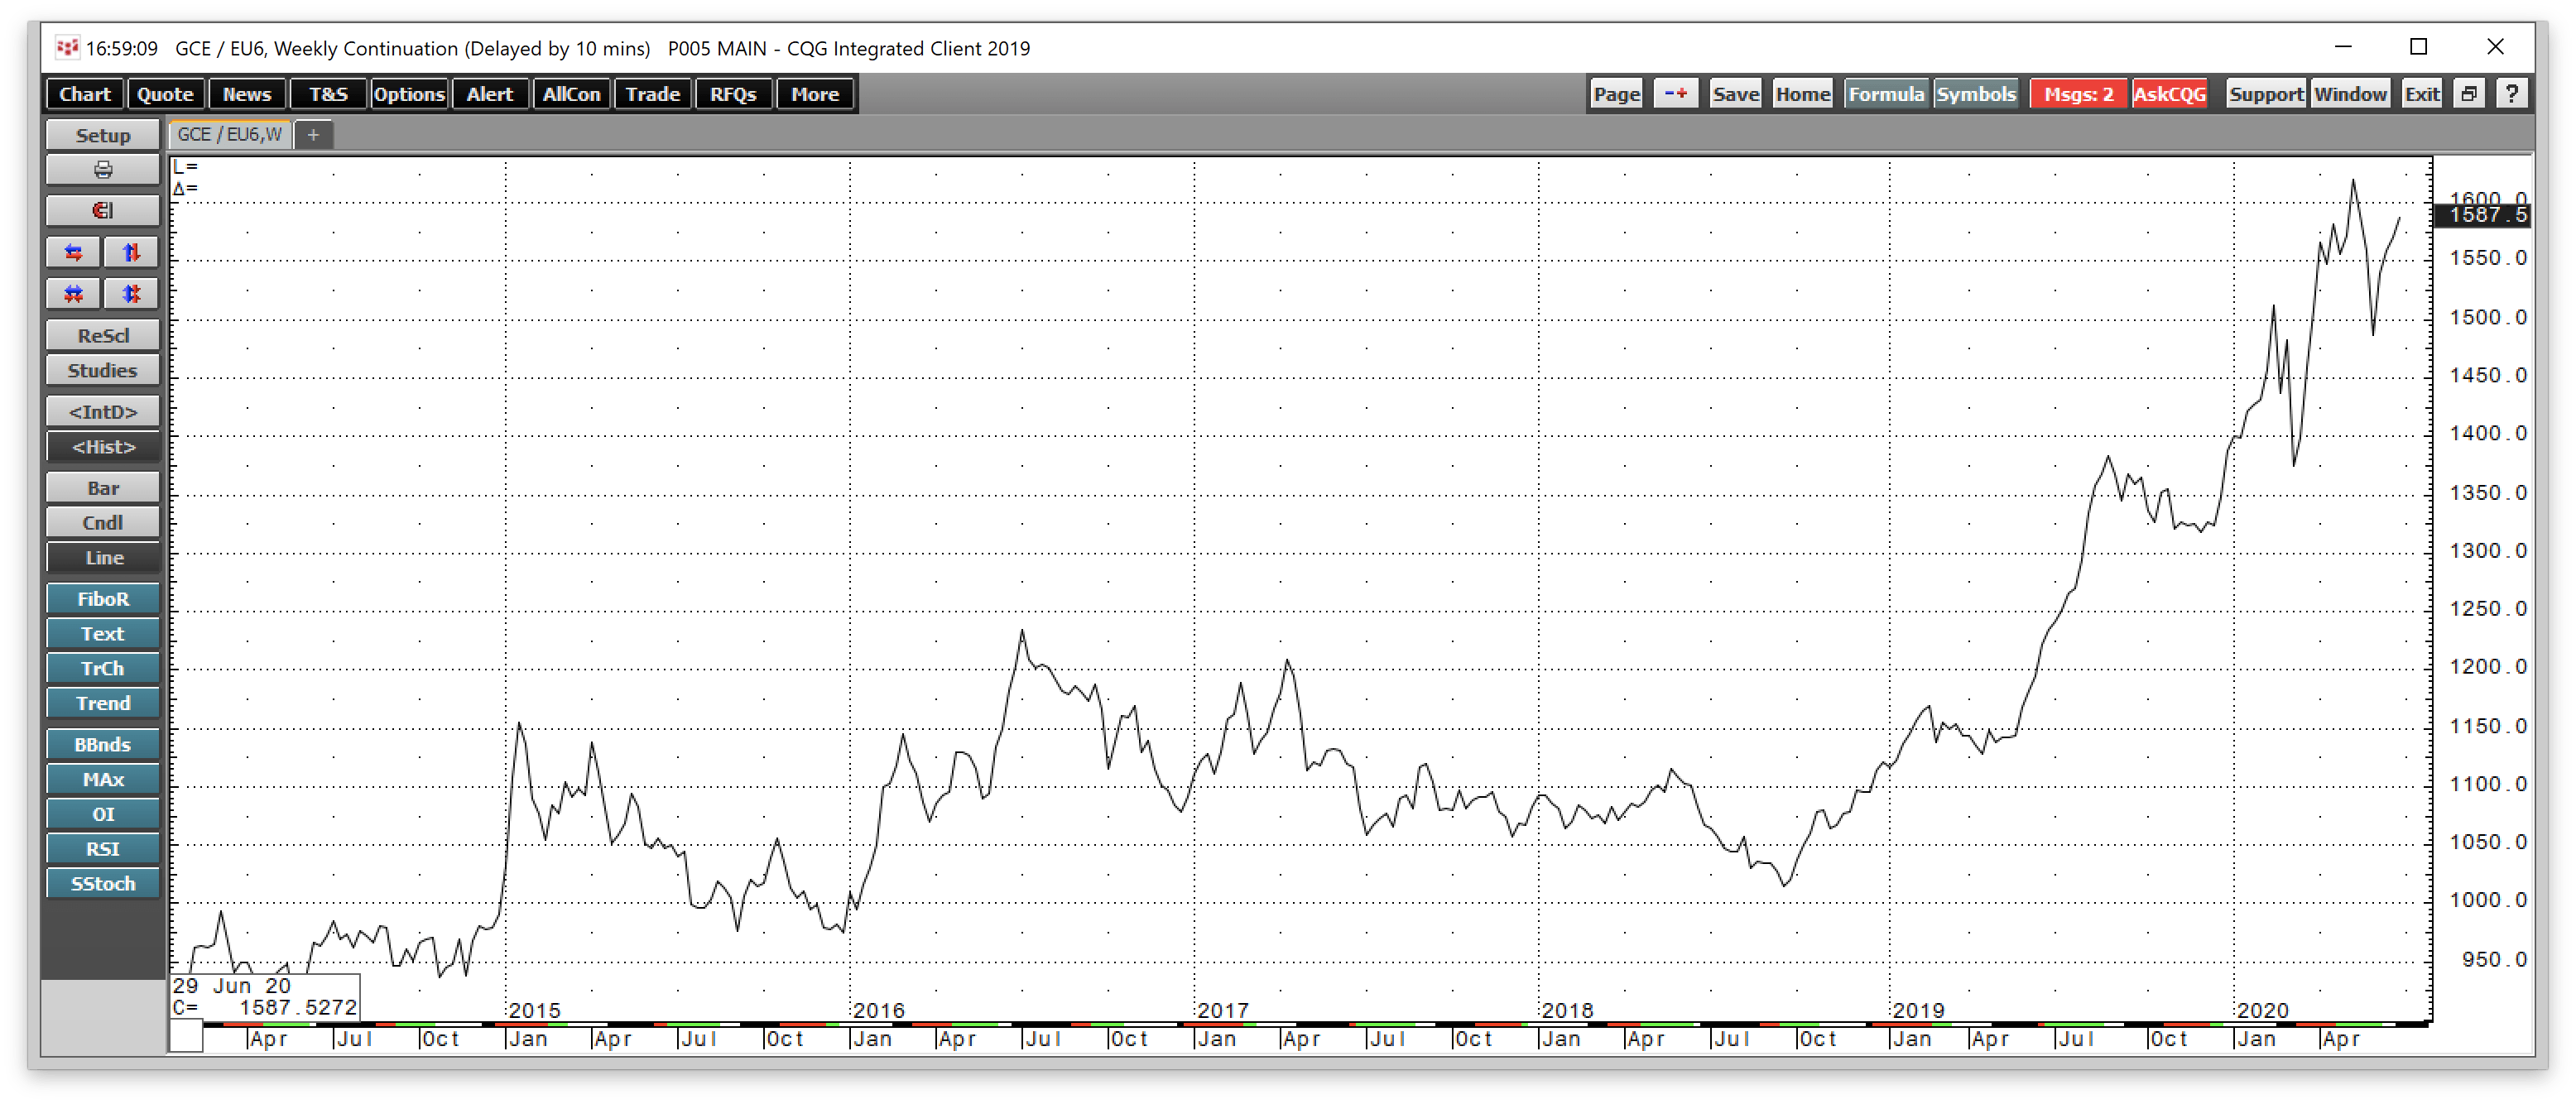
Source: CQG
The weekly chart of gold in euro currency terms shows price appreciation since late 2018.

Source: CQG
In yen terms, gold has also been in bullish mode on the weekly chart.
The GDX, which is an ETF that represents the leading gold mining companies, closed Q2 at $36.68 compared to $23.04 at the end of Q1 2020. GDX rose 59.20% in Q1 after falling 21.31% in Q1. The leading gold mining stocks outperformed the yellow metal in 2019, which was a bullish sign for the gold market. The stocks underperformed in Q1 as risk-off conditions weighed on prices of the mining shares, but the gold mining shares came roaring back in Q2 as they outperformed the percentage gain in gold by more than four-fold.
The GDXJ, the ETF that tracks the junior gold mining companies, closed Q2 at $49.58 after settling at $28.10 at the end of Q1 2020. GDXJ moved 33.51% lower in Q1 but was 76.44% higher in Q2. GDX and GDXJ underperformed the price action in gold in Q1 after significant gains in 2019. In Q2, the gold mining shares did a lot better than the metal, which is a bullish sign for the trend in the precious metal.
Source: CQG
The weekly chart illustrates that gold had been in a bullish trend since the mid-August 2018 low at $1161.40 per ounce. Gold hit a peak at just under the $1808 level on the continuous contract in late June. The price corrected to a low at $1450.90 during Q1 but turned higher and rose to the highest price since 2011 at the end of Q2.
Gold is moving into Q3, making higher lows and higher highs. Price momentum and relative strength were trending higher towards overbought conditions. The weaker dollar, which fell in Q2, is supportive of the price of gold. A dovish Fed is a supportive factor for the gold market. Central banks continue to be net buyers of gold. Central banks continued to buy gold in Q2, but Russia suspended its purchases.
Analysts at Citigroup raised their forecast for the price of gold in Q1, saying they expect the price to reach $2000 over the coming 12 to 24 months. Bank of America expects gold to rise to $3000 per ounce. Gold has made new record highs in all currencies, except for US dollars. In Q2, the Swiss franc fell to a new record low against gold. The rate cuts by the Fed, a return of quantitative easing, and accommodative central bank policy around the world are bullish rocket fuel for the gold market. While the risk of price corrections will rise with the price, I continue to believe gold is on a path for higher highs and a new all-time peak in dollar terms.
Meanwhile, the leader of the digital currency asset class moved higher over the second quarter of 2020, with Bitcoin rising from $6,440.61 at the end of Q1 to $9,135.53 at the end of Q2. The cryptocurrency rose by 41.84% in Q2 and was 26.41% higher over the first six months of 2020.
Silver Review
Silver was 15.32% higher in 2019. In Q1 2020, the price of silver plunged 21.01% as the precious metal underperformed the price action in gold. In Q2, silver came storming back after the dramatic downside spike in Q1 and was 30.98% higher for the quarter. Over the first half of 2020, silver was 3.46% higher than the price at the end of 2019. Silver traded in a range between $11.64 and $19.075 over the first six months of 2020. Silver fell to its lowest price since 2009 in highly volatile conditions in Q1 but outperformed gold in Q2. Silver is a highly volatile precious metal that attracts speculative interest when the price trends.
As we move forward into Q3, I will continue to watch the silver-gold ratio, which closed 2016 at 72.18 and climbed to 76.37 at the end of 2017. The ratio moved higher to 82.45 at the end of 2018. At the end of 2019, the ratio was at 84.99, 2.54 above the level at the end of the previous year. At the end of Q1, the price relationship between silver and gold was at 111.85, 26.86 higher over the three months, and at a record high. The ratio traded to over 124:1 during the first quarter when silver fell to the low. At the end of Q2, the ratio was at the 97.11 level, 14.74 lower than at the end of Q1.
The long-term pivot point for the ratio is around the 55:1 level. Silver underperformed gold in 2017, and the trend continued in 2018 and 2019. The weak performance picked up steam in Q1 2020 but fell below the 100 level at the end of Q2. Silver always has the potential to surprise. As we move into Q3, a continuation of bull market action in the precious metals sector could cause a sudden and dramatic change in the silver market. The next technical target for silver above the Q3 2019 high is at the peak from July 2016. The price action in Q1 did damage to the silver market, but the recovery established the move to below $12 per ounce as a blow-off low.
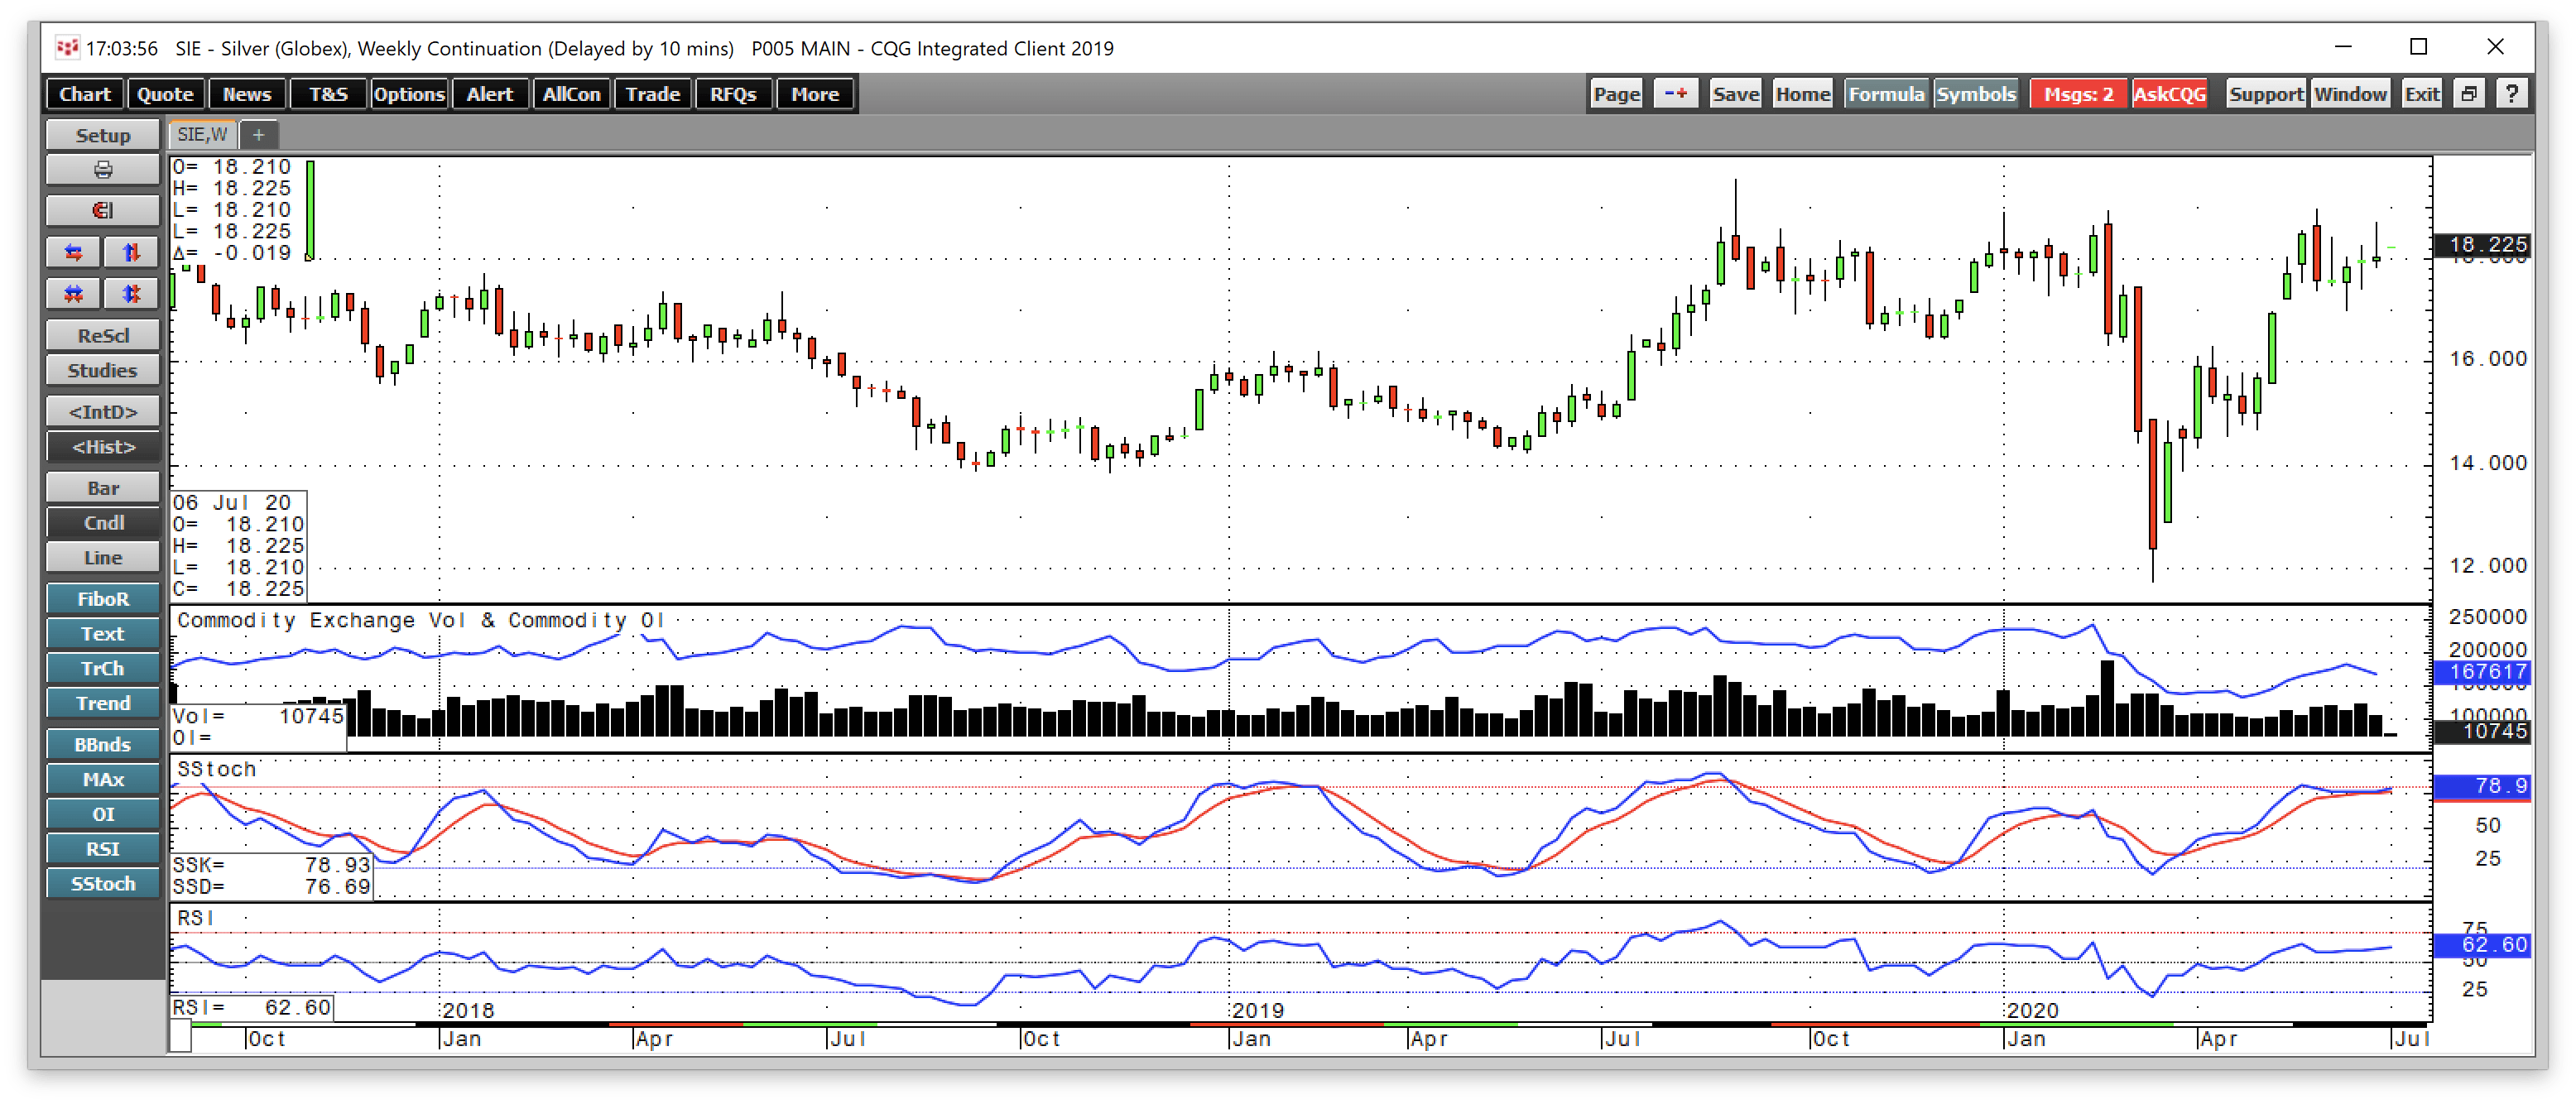
Source: CQG
As the weekly chart highlights, price momentum and relative strength indicators were above neutral territory at the end of Q2. There is a small gap on the weekly chart from $16.975 to $17.015, which could act as a magnet for the price during a correction.
Technical resistance is at the September 2019 peak at $19.54, which stands as the next level on the upside before the July 2016 high at $21.095. Silver blew through the early 2019, 2018, 2017 highs in Q3 2019 before it blew through the support levels on the downside. Silver is a metal that tends to surprise as we witnessed in Q1. Silver closed Q2 2020 at $18.541 per ounce on the continuous futures contract. Expect the unexpected in the silver market and you will never be disappointed.
Platinum Review
Platinum was the second-best performing precious metal in Q2 after tanking in Q1 2020. Platinum moved 15.18% lower in 2018, but it posted a gain of 22.05% in 2019. In Q1, platinum fell 25.43%, but it recovered by 16.05% in Q2. Platinum moved 13.45% lower over the first six months of 2020, as the metal continues to underperform the precious metals sector. Platinum is the only member of the sector that has moved lower since the end of 2019.
Platinum traded in a range between $556 and $1054.60 over the first half of the year and closed the second quarter above the midpoint of the range. In August 2018, platinum fell to its lowest price since the fourth quarter of 2003, a decade and a half low for the precious metal. In Q1, the price fell to $556, the lowest since 2002. Platinum is a metal that offers significant value on a historical basis compared to the prices of all of the other precious metals. However, in Q1, platinum tanked, and fell to the lowest price in almost two decades and underperformed gold, silver, palladium, and rhodium prices. In Q2, the price rallied, but the metal remains a laggard.
As I wrote in the past quarterly reports, “Investment demand has been absent in platinum, and its price has remained weak compared with gold. In September 2017, palladium began gaining on platinum and reached a $150 premium in December 2017. Platinum, like many other industrial commodities, posted a new multi-year low in early 2016 before the price corrected. However, platinum is also a precious metal with a history of attracting investor interest. Eventually, the value proposition for platinum will cause a reversion to the mean against both palladium and gold. I believe that price action dating back to 2008 may have soured many investors on the platinum market. In March 2008, platinum traded to its all-time high at $2308.80 per ounce, and by October of the same year, it fell to $761.80. Over a seven-month period, the precious metal fell $1547 or 67%. The price action in 2008 may have scared investors and traders away from long-term structural positions in the platinum market because of its penchant for volatility and lack of liquidity during that period. However, compared with gold and palladium, platinum has a higher production cost, it is rarer, denser, and has a higher boiling and melting point. These characteristics could one day ignite the price of the metal that has been in a funk since 2014 compared with the other precious metals.” In Q2, platinum moved higher and posted a double-digit percentage gain.
Meanwhile, the fifteen-year low in platinum in Q3 2018 caused some primary producers in South Africa to close mine shafts where higher-cost production is no longer viable as the market price is below the cost of extraction. However, gains in palladium and rhodium over the past years could eventually cause industrial users to turn to platinum as a substitute because of its higher density and higher resistance to heat. Platinum still has lots of catching up to do when it comes to the price action in palladium and rhodium.

Source: CQG
As the weekly chart shows, price momentum was trending lower below neutral territory at the end of Q2. Relative strength was also under a neutral reading. The quarterly chart was just below neutral territory. The monthly chart was on either side of a neutral reading at the end of Q2.
Platinum continues to be a metal with a compelling case for a significant price recovery. However, it also continued to hand out pain to anyone dipping a toe into the platinum market on the long side during attempts at a rally. Platinum has not traded above the $1035 level since early 2017.
Palladium Review
The price of palladium increased in value by 59.48% in 2019. Palladium was the star performer in the commodities market in 2019. In Q1, the bullish party continued as the price of palladium rose by 20.71%. In Q2, gravity hit the palladium market as the price fell by 14.66%. Palladium was still 3.02% higher than the price at the end of 2019 on June 30.
Palladium, a platinum group metal, is a rare precious metal. Russia, more precisely the Norilsk Nickel mines in Siberia and South Africa, produces the majority of the world’s palladium. Like platinum in Russia, palladium is a byproduct of nickel production. Before the explosive move to the upside, the previous all-time high for palladium came in January 2001 at $1090 per ounce. In Q1, the metal peaked at $2815.50 per ounce. Palladium underperformed platinum, its sister metal, in Q2, but the price remains historically high against platinum at the end of the first half of 2020.

Palladium’s correction of 14.66% was not a surprise, but it is impossible to pick a top in a market. The risk in the palladium market increased with the price, and palladium has become a lot more volatile over the past months with the daily and weekly historical measures of price variance rising to well over 100% in March and April. The palladium market was in deficit as supplies could not keep up with demand as Coronavirus spread. The demand for palladium-based catalytic converters around the world that clean emissions from the air have exploded over the past years. However, the slowdown in the global economy was a bearish factor for the precious metal. Palladium was at $1966.90 per ounce on June 30. Betting against the rally in palladium had been a losing proposition since early 2016, but in Q2 it was a profitable approach to the illiquid market.
While palladium underperformed all precious metals in Q2, it had been the consistent star of the sector over the past years. Rhodium, another PGM that had been a bullish beast, put in a marginal decline in Q2.
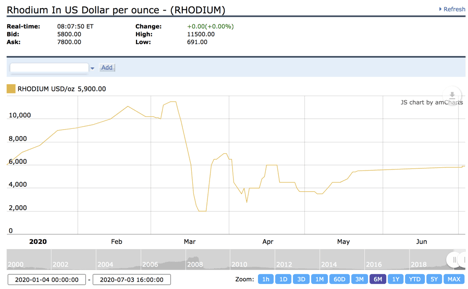
Source: Kitco
Rhodium rose to a new record high in 2020, but gravity hit the rhodium market during the risk-off period in March. Throughout most of Q2, the price of rhodium was steady and edged higher despite the loss on the quarter-by-quarter basis.
The price strength in both the rhodium and the palladium markets over the past years could eventually impact the price of platinum, which has a higher resistance to heat, is denser, and is the only platinum group metal that has a history of significant investor demand. The price action in platinum was encouraging in Q2, but the price remained at a depressed level compared to gold, palladium, and rhodium.
The price situation in platinum had become so dire that primary producers in South Africa trimmed output at higher-cost mines, causing the shortage of rhodium, which is a byproduct of platinum production. At a $1126.20 discount to palladium and an almost $5960 per ounce discount to rhodium, platinum is the wiser economic choice when it comes to most consumer requirements for platinum group metals these days. The value proposition for platinum continues to be compelling as we move into Q3, but that does not mean that the spreads at divergent historical levels cannot move further away from norms, as I wrote throughout 2019. Platinum has been a very frustrating investment, while palladium and rhodium have offered incredible rewards since 2016. It could be only a matter of time before a magnetic parabolic move in the platinum market occurs. In Q2, platinum displayed some signs of life, but the price will need to move above the $1035 per ounce level to encourage investment demand.
The bottom line and cryptocurrencies
Palladium and rhodium fell in Q2, while silver, platinum, and gold posted gains. At the end of the first six months of 2020, gold is the leader with an over 18.2% price jump. Silver tends to attract the most speculative demand, and it displayed signs of bullish life in Q2. The prospects for Q3 and beyond are different for the various metals. Palladium and rhodium are industrial metals. The decline in platinum output should continue to provide support for rhodium, but it is at a lofty level at an all-time high. When it comes to palladium, rising demand for catalytic converters across the globe is supportive of the price of rare metal. The decline in open interest is a sign of rising illiquidity, which increases the potential for wild price swings on the up and downsides. Economic contraction could weigh on the demand for new automobiles and palladium.
A weaker dollar is typically bullish for gold and other commodities, but they had rallied even as the dollar moved to higher levels in 2019 and early 2020. Currency markets became highly volatile during the deflationary spiral in markets in March, and the dollar index has been trending lower since the period of increased price variance. Meanwhile, central banks and government stimulus weigh on the value of all fiat currencies. While they can print legal tender to their heart’s content, the only way to producer more gold is to extract it from the crust of the earth. Central banks hold the yellow metal as an integral part of their foreign exchange reserves, which validates gold’s role in the global financial system. As we head into the second half of 2020, the landscape for gold remains highly supportive of higher prices for the precious metal.
Meanwhile, lower interest rates and falling currency values worldwide provided support for the level of digital currencies in Q2.
In Q2, Bitcoin rose 41.84% and was 26.41% higher since the end of 2019. Ethereum moved 68.67% higher in Q2 and was 77.85% higher over the first six months of this year. Litecoin’s value moved 6.16% to the upside in Q1 and was only 0.91% lower in 2020. Ripple was 0.12% lower during the first quarter and fell 9.24% since the end of December 2019. Bitcoin Cash rose 0.72% in Q1 and was 7.48% higher so far this year. Bitcoin Gold gained 40.47% in Q1 for a total gain of 88.79% in 2020. The market cap of the entire digital currency market, which comprises 5,688 tokens, up 403 from the end of Q1 20202, increased from $181.094 billion at the end of Q1 to $259.705 billion at the end of Q2 2020 or 43.41%. The market cap moved 35.31% higher since the end of last year. The market cap peaked at over $800 billion in December 2017. Bitcoin underperformed the sector in Q2 and throughout the first six months of 2020.
The significant increase in new tokens diluted the asset class. An ETF product that trades on the stock exchange and solves the custody issues could turbocharge gains in the world of cryptocurrencies. However, governments continue to express concerns as they will not relinquish their control of the money supply to the new breed of currency instruments. China and Russia have currencies that are not fully convertible, so those governments are likely to crack down on digital currencies. In those countries, the need for cryptocurrencies is compelling for individuals. The US remains concerned about the rise of the popularity of the instruments. Congress was uniformly opposed to Facebook’s attempt to put together a consortium for the Libra token.
Meanwhile, I am bullish on the digital currency asset class as it is a rejection of central bank and government management of the money supply in individual countries and from a global perspective. The rise of the asset class is a freight train that could be impossible to stop. However, I expect lots of wild volatility. I would only buy Bitcoin or the other tokens during periods of price weakness.
I am going into Q3 with the same bullish orientation to the precious metals sector at the end of Q1 and 2019.
The GLTR is an ETF that represents a basket of the four precious metals that trade on the COMEX and NYMEX divisions of the CME for those who want exposure to the sector without trading the individual metals. GLTR is a liquid instrument with $548.09 million in net assets, and an average of 35,142 shares trading each day. Both the net assets and average daily volume decreased from the end of Q1 2020. The top holdings of GLTR include: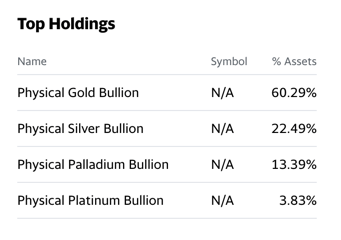
Source: Yahoo Finance
Precious metals may continue to be one of the most exciting sectors during the second half of 2020, given their long history as monetary instruments and stores of value. GLTR moved from $75.10 at the end of Q1 to $83.53 per share at the end of Q2 2020, an increase of 11.22% for the quarter that ended on June 30. GLTR kept pace with the composite given GLTR’s holdings, which were 60.29% invested in gold and 22.49% in silver. Gold and silver were 13.71% and 30.98% higher for the quarter, respectively. The next leg of the bull market in gold began in the early 2000s. It continued in 2019 and the first half of 2020. The prospects for Q3 continue to look golden. Expect lots of volatility in all members of the sector over the coming months.
Any investment involves substantial risks, including, but not limited to, pricing volatility, inadequate liquidity, and the potential complete loss of principal. This document does not in any way constitute an offer or solicitation of an offer to buy or sell any investment, security, or commodity discussed herein, or any security in any jurisdiction in which such an offer would be unlawful under the securities laws of such jurisdiction.
The Hecht Commodity Report is one of the most comprehensive commodities reports available today from the #2 ranked author in both commodities and precious metals. My weekly report covers the market movements of 20 different commodities and provides bullish, bearish and neutral calls; directional trading recommendations, and actionable ideas for traders. I just reworked the report to make it very actionable!
Disclosure: I/we have no positions in any stocks mentioned, and no plans to initiate any positions within the next 72 hours. I wrote this article myself, and it expresses my own opinions. I am not receiving compensation for it (other than from Seeking Alpha). I have no business relationship with any company whose stock is mentioned in this article.
Additional disclosure: The author always has positions in commodities markets in futures, options, ETF/ETN products, and commodity equities. These long and short positions tend to change on an intraday basis.
Author: Andrew Hecht
Read more at: https://seekingalpha.com/article/4357076-precious-metals-and-cryptocurrencies-second-quarter-2020-review


