


- Typical consolidation day in the crypto-board while indicators adjust after last week’s rises.
- Interest in cryptos increases shyly after first real turnaround possibility.
Yesterday was a quiet, positive day. It was an easy day for most assets, although they are getting renewed, positive attention. Today, Barclay’s LTD announced the creation of a crypto market negotiation board, another row in the list of financial businesses using cryptos. Each new such initiative supports their validity as value change tool.
BTC/USD 240 min
Bitcoin moved downwards yesterday, trading below $8,100 most of the day. A usual strategy used to get rid of weak positions without damaging the price. Below, there are still yesterday’s supports, the main one on the closing price of $7,980. A strong support stands at the 200-SMA and 50-EMA, $7,700. In the bearish extreme, a price range between $7,300 and $7,400.
Above, it needs to close past $7,400, consolidate that level and continue to $8,950, a difficult obstacle.

The 240 min MACD keeps adjusting the height, but it shows the possibility of a new surge in the late European session.
The Directional Movement Index also shows a small purchases upturn. Sales are still below but close, although a sudden change could yield control to sellers.
LTC/USD 240 min
Litecoin is full of bullish force in the European morning, getting to its next resistance, the last relative maximum at $134. Above, the 200-SMA at $137, with few chances of a clean break. If it manages to surpass it, it would send a strength message that would activate buys. The next resistances would be at $139, $148 and $158. Below, there isn’t any important support until the 50-EMA at $125.30, followed by the 100-SMA at $120.93.
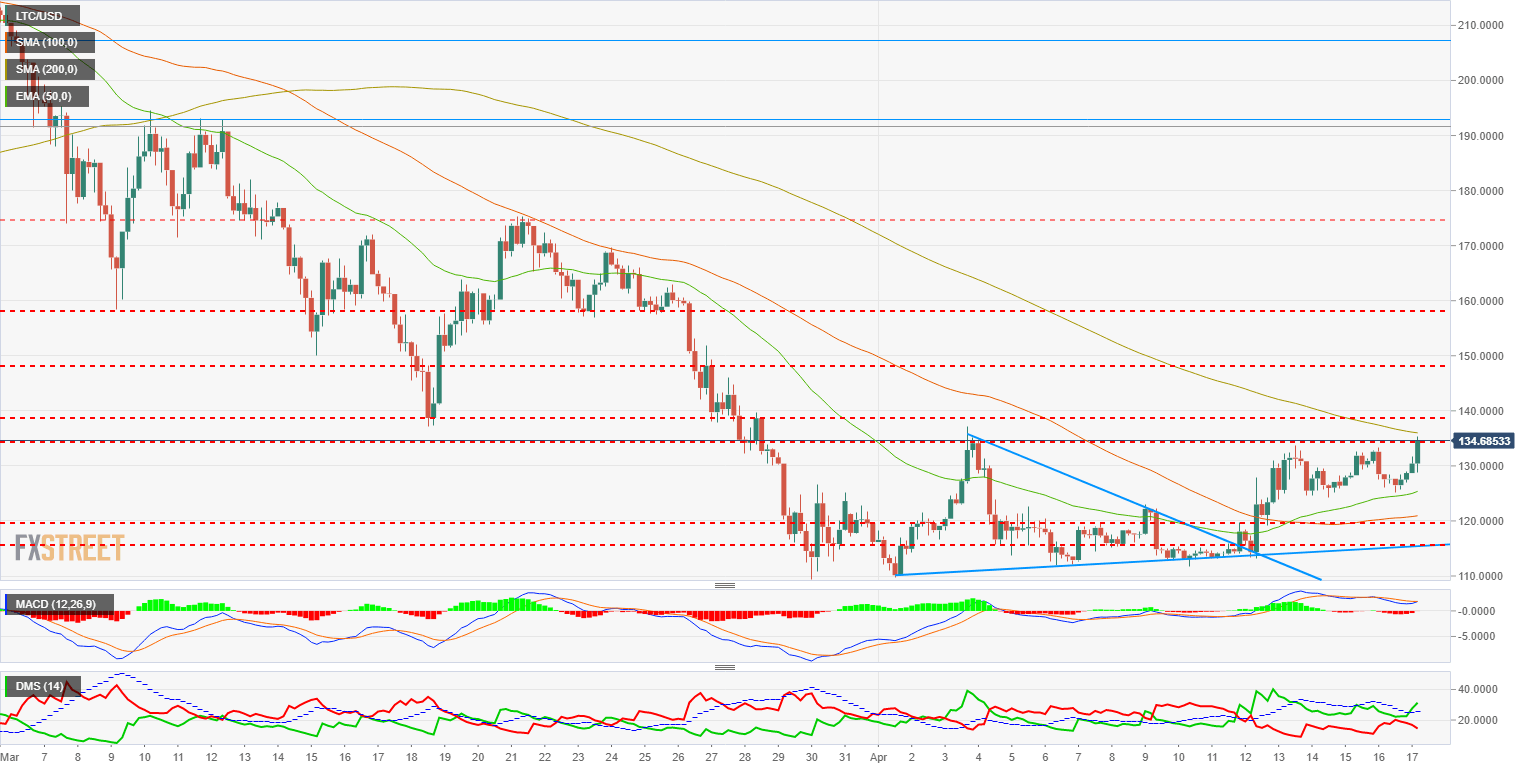
The 240 min MACD is similar to Bitcoin’s. Divergent profile that shouldn’t be an obstacle for a bullish continuation, but only a structural weakness sign.
The Directional Movement Index is positive for Litecoin, with the D+ breaking to the upside the ADX while sellers retreat.
XRP/USD 240 min
Ripple followed a similar path to Bitcoin’s, consolidating its current level with some bearish walk to get rid of weak hands. It now moves below the support, while the moving averages develop rising slopes and adapt to the new setting.
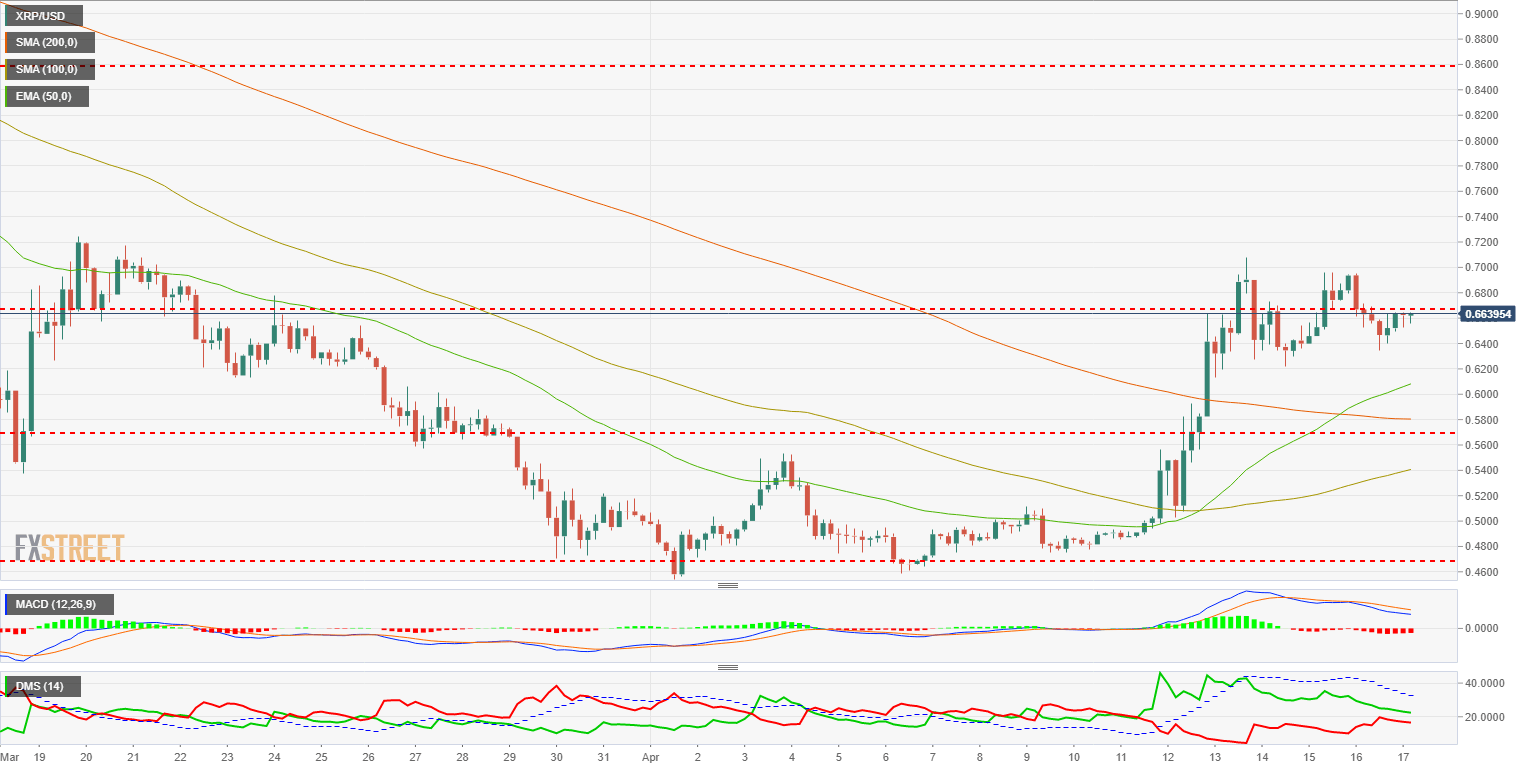
The MACD mimics Bitcoin’s and Litecoin’s, with hopes of a new upside cross that wouldn’t reach the recent maximums. Bullish continuation with weakness signs if the move is not wide enough.
In the Directional Movement Index, the D+ can’t reach past the ADX but shows a rising reaction. Sellers decrease slightly and can’t get to the 20 mark. The ADX comes with the price rises, after a decreasing trend.
ETH/USD 240 min
Ethereum follows the same way as the rest. It consolidated the price range reached previously. Key support at $487, with the 50-EMA, now at $477, is getting closer from below. The 200-SMA is at $465.
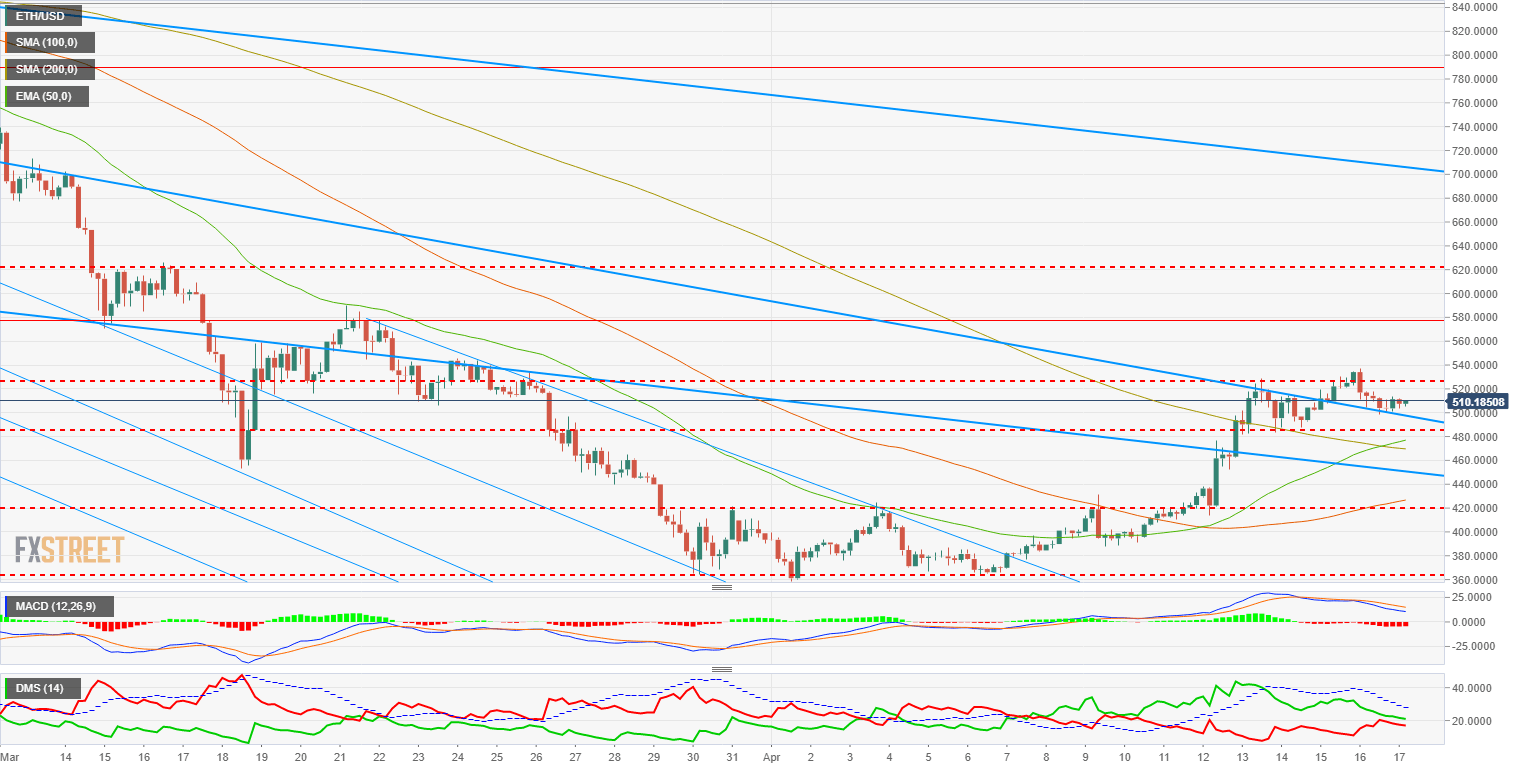
The MACD and its predictions are identical to the rest.
The 240 min Directional Movement Index is the weakest of all 4 assets. In spite of buyers having control, their volume is too low and the ADX doesn’t react either. Indicator to look at in the next sessions.
Read more at: FX Street


