


Bitcoin price action continues to slide in favor of bears as the cryptocurrency dips below $8,000 for the second time in 7 days and a bear reversal is clearly in play.
MARKET OVERVIEW
‘Rumour has it Bitcoin won’t see 10k anymore’ would serve as a suitable alteration to the chorus of Adele’s mega-hit, ‘Rumour Has It.’ It’s obvious that for the time being, bears are in full control of bitcoin price but this time it’s a little bit harder to discern the source of BTC’s recent turmoil.
Could it be one of the following?
- Lingering effects of the Mt. Gox sell off?
- Simmering scandal from the Upbit and Bithumbinvestigations?
- Or perhaps it’s the whales on the run phenomenon as Bitfinex requested client tax and social security information to comply with federal SEC regulations?
Those partial to conspiracies might be willing to entertain theories of institutional investors and whales manipulating prices to buy near the bottom before flooding crypto markets with cash and bringing on the greatest pump 2018 will ever see.
Whatever the reason(s), Bitcoin is currently stuck in the mud, and it appears likely to continue languishing as the expected purchasing appetite just isn’t present right now.
DAILY CHART
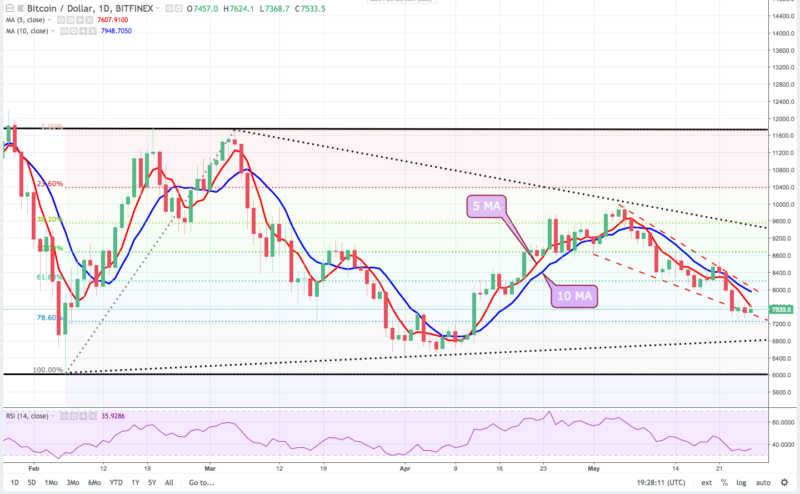
- The RSI has struggled to stay out of bearish territory (above 50) and a pattern of lower highs and lower lows continues as BTC slipped below the downward channel and is down nearly 15% over the last seven days.
- Notice that the RSI is not oversold (above 30) which supports the possibility of further price decline and in the event of a deep sell-off, BTC could drop below lower leg of the triangle.
- At the time of writing, the 5-day MA sits below the 10-day MA and both are sloping downward indicating further short-term decline.
- Last week the concern was whether BTC would dip below the 61.8 percent Fibonacci retracement level whereas this week there is the possibility of a full retrace back to the April low near $6,425.
4HR CHART
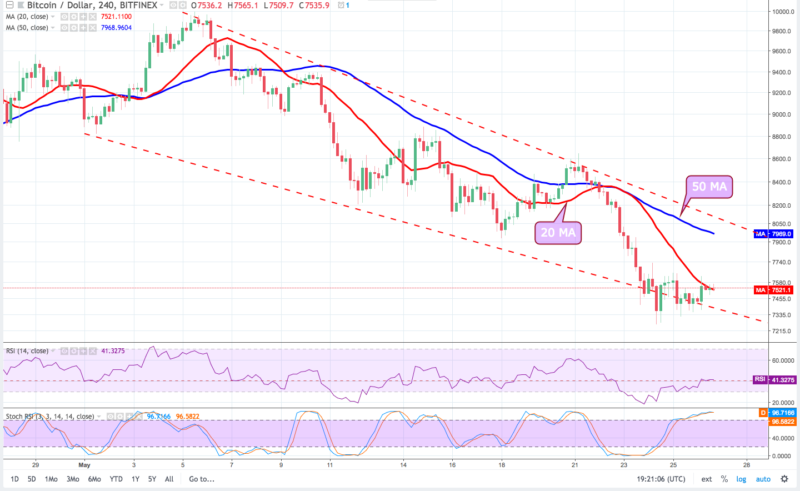
- The 4-hour chart shows the 20-day MA well below the 50-day MA as both trend downward. At the moment, BTC is nowhere near crossing the 50-day MA at $7,969 and remains far away from the recent high (May 21) at $8,644.
- Notice that the Stochastic oscillator approaches overbought territory, yet BTC price continues to decline, opening the door for deep loses in BTC price as there is plenty of room for the oscillator to fall in the event of a sell-off.
- At the time of writing the RSI is flattening while remaining near bearish territory which is indicative of further decline (see the direction of moving averages) but it is possible that BTC could continue trading sideways for the short term until buyers, sellers or some breaking news event impacts BTC price.
- Alas, all is not lost in the world of cryptocurrency. In a recent Twitter post, The Crypto Fam make a strong case that this current bear reversal will end near $7,000 and purchasing appetite for BTC will return as whales, small investors and institutional investors return to purchase BTC near the bottom.
VISION
- BTC is nearing a full retrace to the April low near $6,425. Panic selling below $7,000 could open the doors for price decline below the lowest support at $6,000
- A full retrace to $6,425 could signal the completion of the current bear reversal.
- BTC needs to close above the 50-day MA at $7,969 and sustained price gains above the upper descending channel ($8,050) would indicate that the current correction has ended.
As highlighted by The Crypto Fam, each leg down in the bear market since December 2017 has have shown reductions in selling volume and the price drops less extreme. They have interpreted this as an indication that the bear market is running out of steam as bears, whales, and market makers have reduced their BTC holdings and will be prepared to purchase aggressively once the cryptocurrency reaches a bottom.
Their charts, along with the daily chart in this article show a bottom somewhere between $6,000 – $6,800.
Traders are advised to watch from the sidelines as most technical indicators show bears having the advantage but aggressive investors could consider purchasing when the 20 and 50-day MA reverse and maintain upward momentum on the 4-hour chart.
At current prices, longs could take positions starting at $7,300 (and probably below) as Bitcoin has been range bound between $6,000 to $12,200 since February 2018.
Read more at: Bitcoin


