


- Bitcoin goes down, following the technical script.
- Ethereum finds support at $460 and should wait for another opportunity.
Ripple stares down the abyss but still stands on its feet.
News come through the wires that the SEC has denied the petition to launch a Bitcoin ETF. The US regulator argues that the proposal lacked control and safety, but doesn’t address the status of BTC, the underlying asset.
Here’s an excerpt of the SEC statement, by Commissioner Hester M. Peirce –
“ that its disapproval does not rest on an evaluation of whether bitcoin, or blockchain technology more generally, has utility or value as an innovation or an investment. Rather, the Commission is disapproving this proposed rule change because, as discussed in detail below, BZX has not met its burden under the Exchange Act and the Commission’s Rules of Practice to demonstrate that its proposal is consistent with the requirements of the Exchange Act Section 6(b)(5)”
As expected, Bitcoin has been the Cryptocurrency most severely damaged by these news, but the falls can be framed into a logic technical development and, for now, have not changed a piece the short-term outlook.
This is another very interesting excerpt from SEC’s Commissioner Hester M. Peirce:
“The concerns underlying the disapproval order go to the merits of bitcoin—and thus the bitcoin-based ETP at issue here—as an investment. The order raises concerns about potential future actions of potential large holders of bitcoin,[9] academic speculation about past manipulation in the market,[10] and the lack of regulation of the spot market.[11] Indeed, if the disapproval order’s rigorous standard were applied consistently, many commodity-based ETPs would be in peril, as rumors of manipulation plague many commodity markets,[12] and surveillance-sharing agreements with regulated markets cannot eliminate the sometimes messy nature of the commodities markets. “
BTC/USD 1 D
Above the current price, BTC/USD is targeting the week’s highs. At the moment, BTC/USD is bouncing back upwards after a decline back to the 23.6% Fibonacci retracement level. The first resistance for BTC/USD is located at the $8,000 price level. Above this level, another resistance by price congestion at $8,200 would be on the verge of a future attempt at the relative highs at $8,479.68.
If BTC/USD breaches these relative highs, the theory tells us that the potential for movement is above the $11,500 level.
Below the current price, potential for downward continuity to the next levels of recession. The next retracement level is the 38.2% Fibonacci retracement level and would bring BTC/USD price back to $7.440. Below this price level, the next key retracement level, the 50% Fibonacci retracement, would bring BTC/USD to $7.133. We need to remind that regression is within the normal range until the level of 61.8% of Fibonacci. Moreover, technically this retracement is positive because it removes any doubt from open positions and eliminates “weak hands.”
Click to see the Full Customized Chart
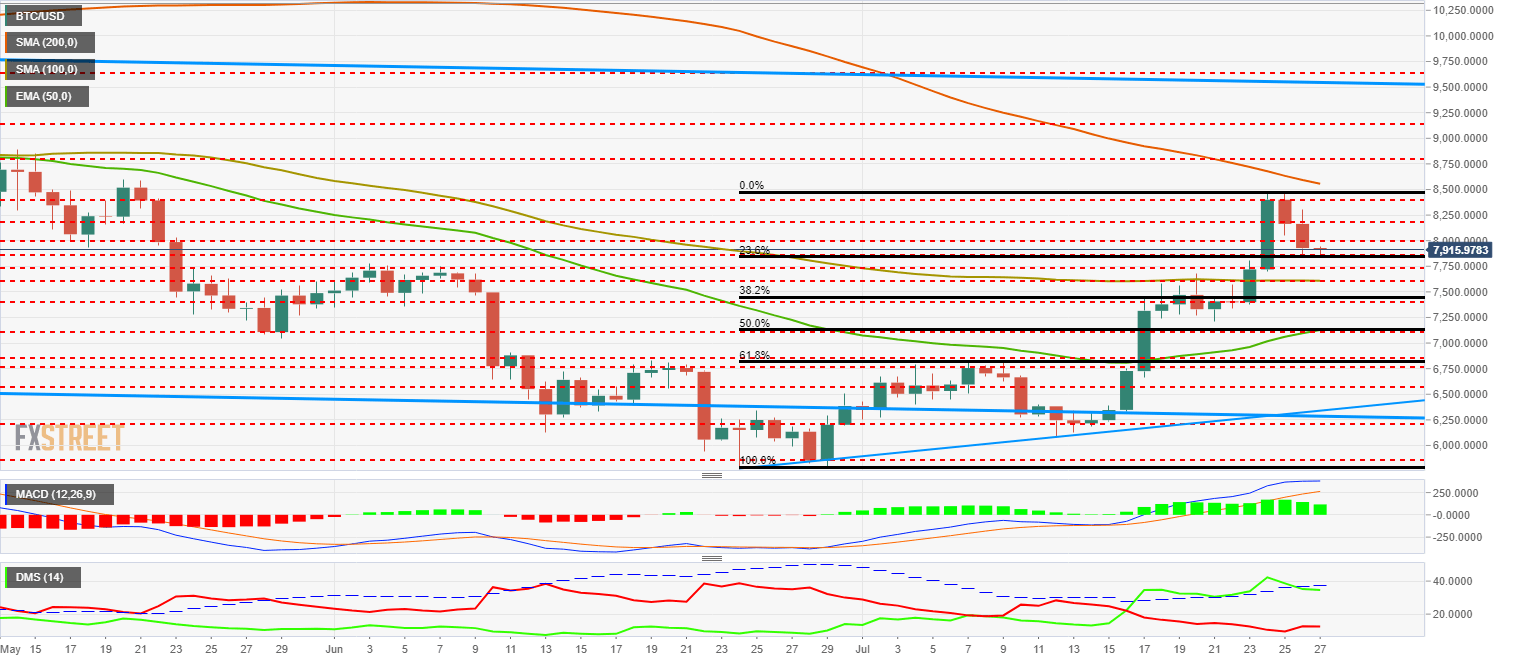
The MACD at 240 Min shows a down-cut profile with amplitude and inclination. The movement goes to the 0 line and should not drill such level, although I have already seen in Bitcoin on several occasions how this rule has been broken and the 0 level has been drilled to cut itself upwards from a little lower.
The Directional Movement Index shows how important sales have been in equalizing the level of selling activity at this time to that of the buyers. The ADX has a significant reduction in its level but is still a long way from ending the trend.
ETH/USD 240 Min
Above the current price level of $465, Ethereum should recover as quickly as possible above the moving averages, otherwise, ETH/USD may get caught between there and the support level of $460. If it manages to be above the moving averages, expect a short-term bullish scenario with the first target at the $520 level, followed by the short-term target price at $620.
Below the current price, there is not a lot of room, and the analysis is clear. Two levels of support separate Ethereum from serious problems. First support at tonight’s lows at the $460 price level. The next level and the truly critical one, at the trend line from this year’s lows, which is currently at $440.
Below this level, the chances that ETH/USD would reach new year lows would increase exponentially.
Click to see the Full Customized Chart
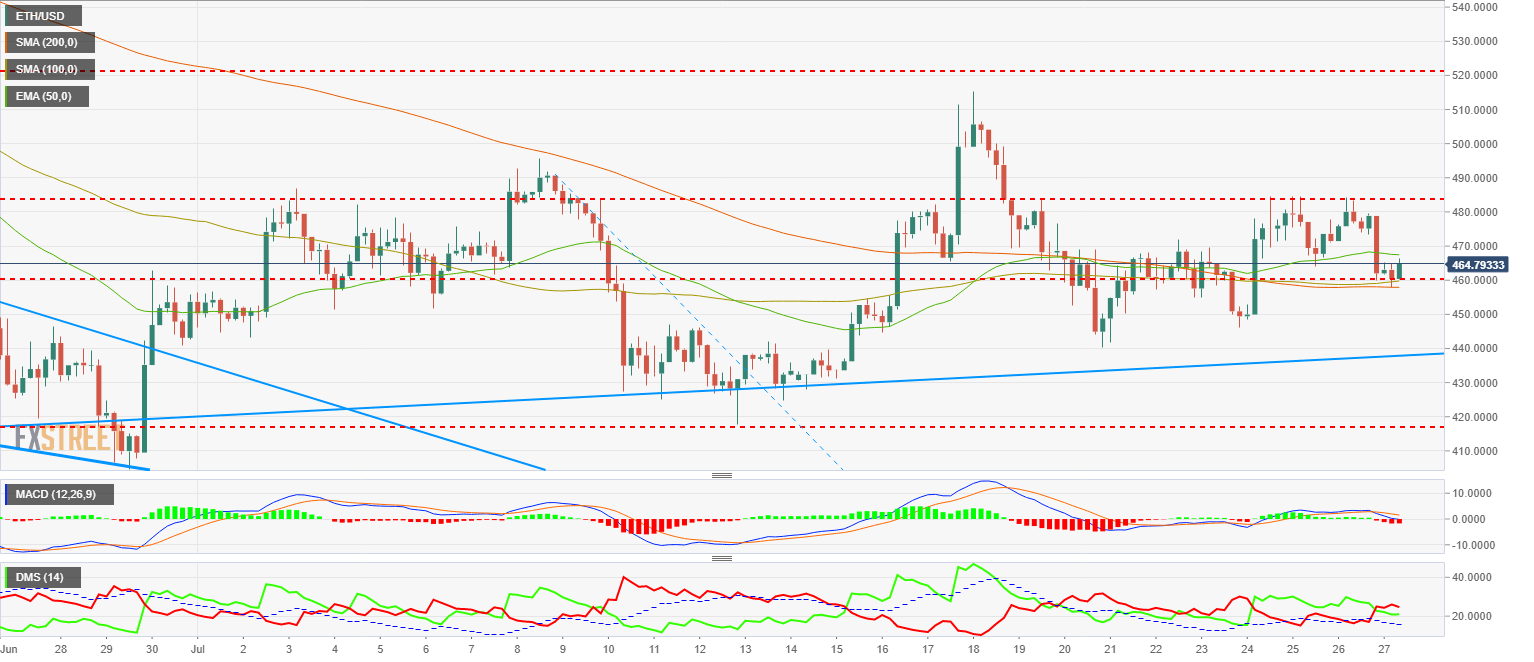
The MACD at 240 Min crosses down and rests on the 0 line of the indicator. It hardly shows inclination, but it does show some opening. On the other hand, it is a favorable setup if there is an upward turn, as it would allow a higher angle in the stocking cut.
The Directional Movement Index at 240 Min show sellers taking control of the situation while buyers are slowing down without falling below level 20 of the indicator. The ADX continues to show no signs of trend.
XRP/USD Min
Above the current price level at $0.452, Ripple maintains the goal, not to mention the need, to reach the $0.50 level. Conquering that level of resistance would bring peace of mind to the XRP/USD market. Previously, it should breach the SMA200, SMA100, and EMA50 in the 4H range, and these lines are grouped between the price levels of $0.4578 and $0.4644.
Below the current price, the analysis of the XRP/USD leaves us more vital information. First support at the $0.44 price level, followed downwards by the next support level at $0.4256. Up to this price level, the drop would only add nerves to the market, but should not cause panic. The next level of support is something else. This last relative support for the XRP/USD is at the level of $0.40 and in no case should be lost, since below this price the first support is located around the price level of $0.25.
Click to see the Full Customized Chart
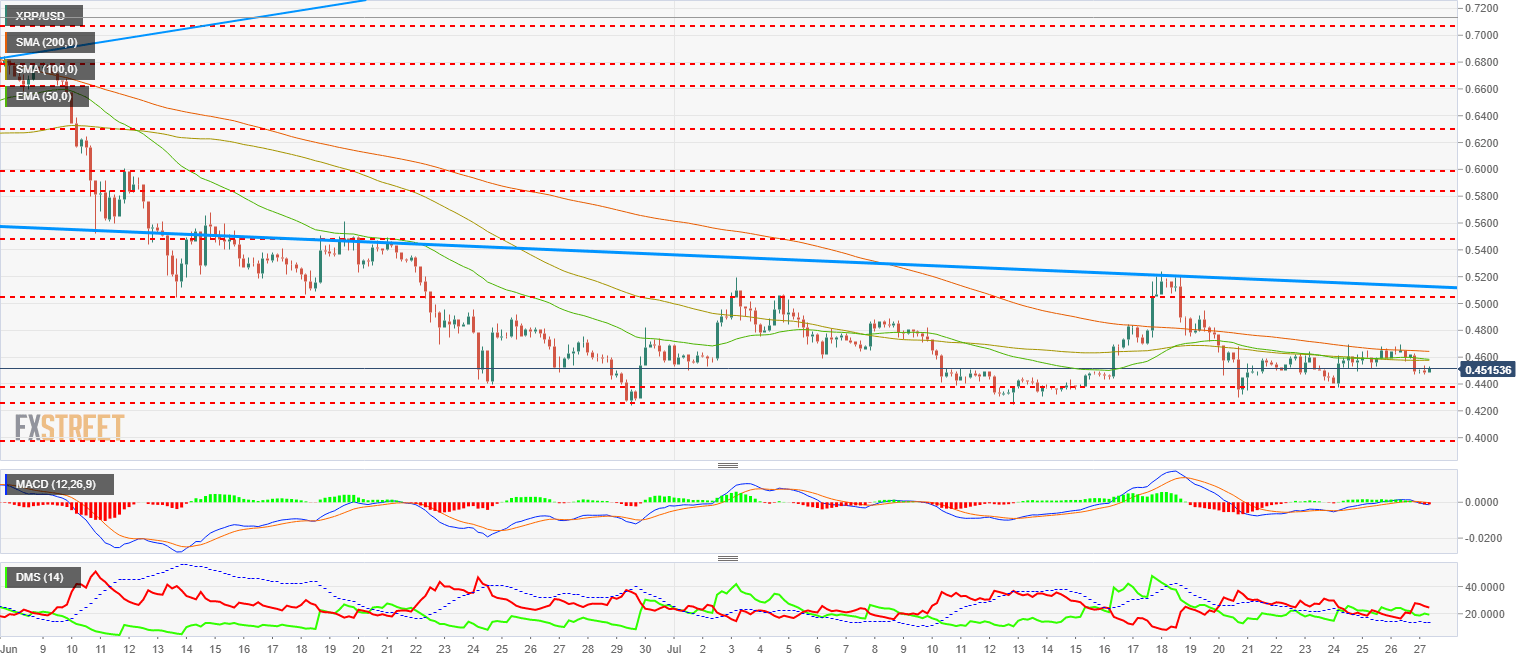
The MACD at 240 min is cut to the downside and is slightly below the level of 0. Right now, it seems to try a bullish cross, but being below the balance line raises questions about the future development.
The Directional Movement Index at 240 Min shows the sellers with control of the situation, while the buyers decrease slightly and move closer to level 20, which indicates the existence of a trend. The ADX at the lowest levels of many weeks gives an idea of the laterality of the movement of the XRP/USD in the last sessions.
Read more at: FX Street


