


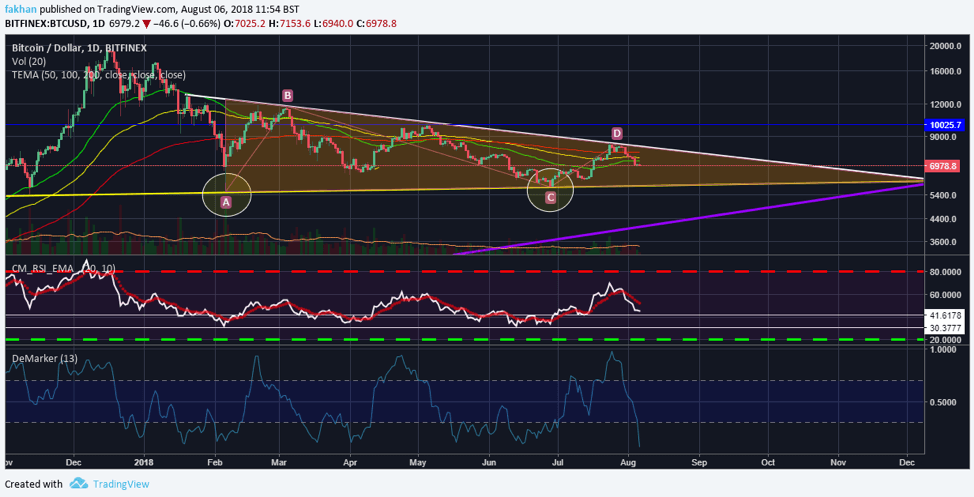
Bitcoin (BTC) is not starting a new cycle before it falls down to $5,800 again. In order for Bitcoin (BTC) to begin a new cycle, it has to find a bottom first. So far, the price has marked lower highs and lower lows since the beginning of this correction as can be seen on the daily chart for BTC/USD above. If Bitcoin (BTC) had already found a bottom, then it would have been possible to break the downtrend at this stage and start a new cycle. This is because most technical indicators are already in oversold territory and a trend reversal at this point would not have been a surprise.
However, despite the fact that Bitcoin (BTC)’s RSI is nearing oversold levels and the DeMarker indicator is signaling a near term reversal, the price has failed to find a bottom so far. The price started trading in a triangle since January this year and has yet to break above or below it. Bitcoin (BTC) has managed to touch the lower limit of this triangle at $5,800 two times now. There is no doubt as to whether or not it will touch the lower limit of this triangle for the third time. The question though is whether it will put in a bottom to begin a trend reversal or will it fall lower to enter into a long term bear market?
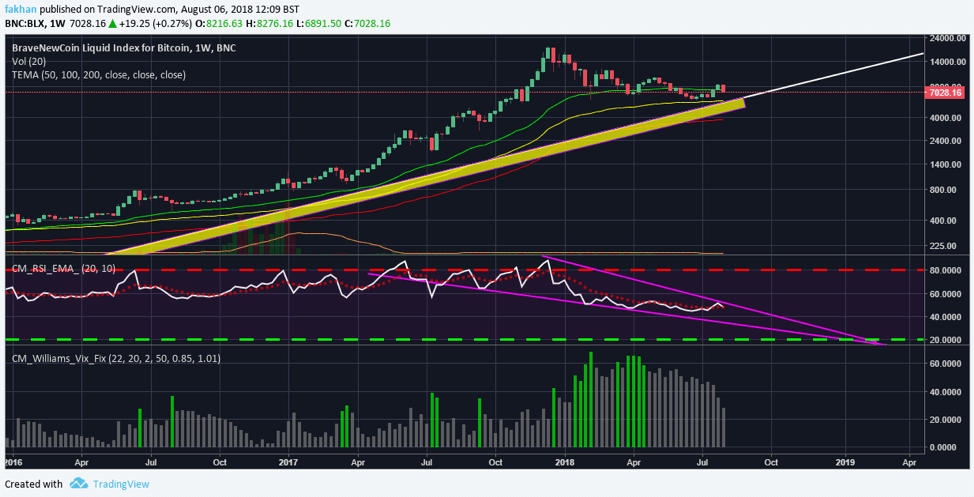
The above weekly chart for BNC:BLX demonstrates a lot better that Bitcoin (BTC) has not found a bottom yet. Since the beginning of 2016, the price started to fall near the bottom of Bitcoin (BTC)’s long term ascending channel. In order to complete a correction, the price had to put in a bottom by testing the lower limit of this ascending channel. The yellow bar below the trend line shows the timeframe Bitcoin (BTC) was expected to put in a bottom, but it did not. To the surprise of some early investors, Bitcoin (BTC) even made a new ATH but it still did not put in the bottom.
Most investors who got in the game just recently think that Bitcoin (BTC) Futures or whale manipulation has to do with the recent correction. I agree that those were the catalysts but I disagree that those were the reasons. The argument is same as before. Early investors knew that Bitcoin (BTC) did not finish what it started. The price had to touch the bottom of this ascending channel before beginning a new cycle. Never in the history of Bitcoin (BTC) has the price started a new cycle without touching the bottom of the ascending channel first.
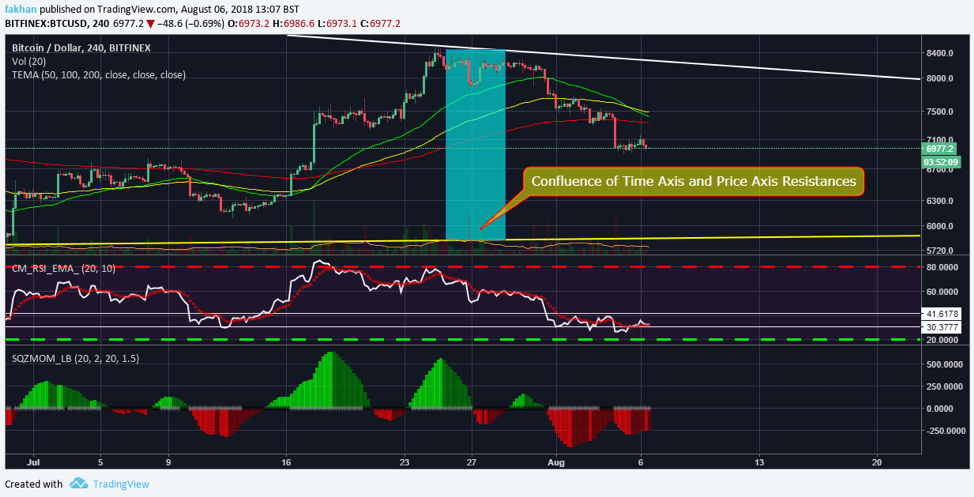
The resistance that Bitcoin (BTC) ran into back on July 27 as can be seen above on the 4H chart for BTC/USD was already expected as pointed to in one of my previous analyses. This was a strong impediment to further upside as it was a confluence of time axis and price axis resistances. While many were calling for a climb to $10,000 from there, we called for continuation of the correction. The price action post July 27 is a mirror image of the price action before that. It is in the best interest of Bitcoin (BTC) that its price tests the $5,800 level again to put in a bottom, so that a new cycle can begin.


