


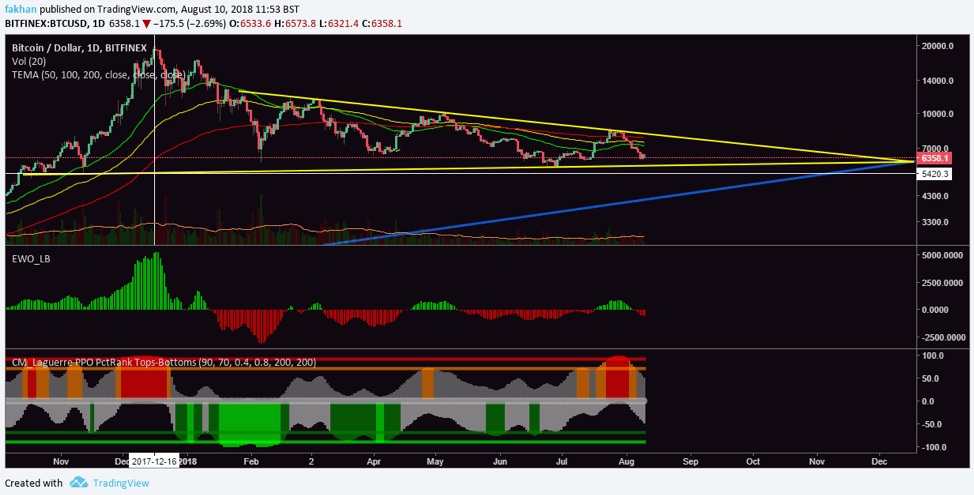
Bitcoin (BTC) is weeks away from reaching the end of an overextended correction. The triangle in which Bitcoin (BTC) has been trading for the last seven months has become easier to break now that the price has traded further along it. Elliot Wave Oscillator for the BTC/USD daily chart above shows the price to have reached the limit of aggressive movements and will likely stabilize over the next few weeks before beginning a new cycle. So far, Bitcoin (BTC) has respected the long term support line, but in order to complete this correction, Bitcoin (BTC) will have to test its long term trend line at some point.
The Laguerre PPO indicator on the lowest portion of the above chart shows that the price has yet to find a bottom and can be expected to fall further in the days ahead. The EMA alignment continues to remain bearish, with the price trading well below the 50 EMA. The volume has started to shrink again and market sentiment has turned from slightly bullish to bearish once again. In the past few weeks, the market has reacted aggressively to Bitcoin (BTC) ETF news. The first blow came when the ETF proposal presented by the Winklevoss Twins was rejected by the SEC. The market tumbled as expected but overreaction to the news dragged the price further down. To add fuel to the fire, a decision delay on the VanEck/SolidX Bitcoin ETF dealt a major blow to Bitcoin (BTC) in general and most altcoins in particular.
Bitcoin (BTC) correction has worn out most crypto investors used to big daily gains. Some impatient enough to navigate the choppy waters have had to suffer the most, when what they thought was a reversal turned into another correction. In fact, it would not be unreasonable to name the entire seven months price action for Bitcoin (BTC) as the False Hope Pattern. Since the beginning of February, there has been three such false hope cycles, where at the end of every cycle, mainstream investors are misled into thinking this is the end.
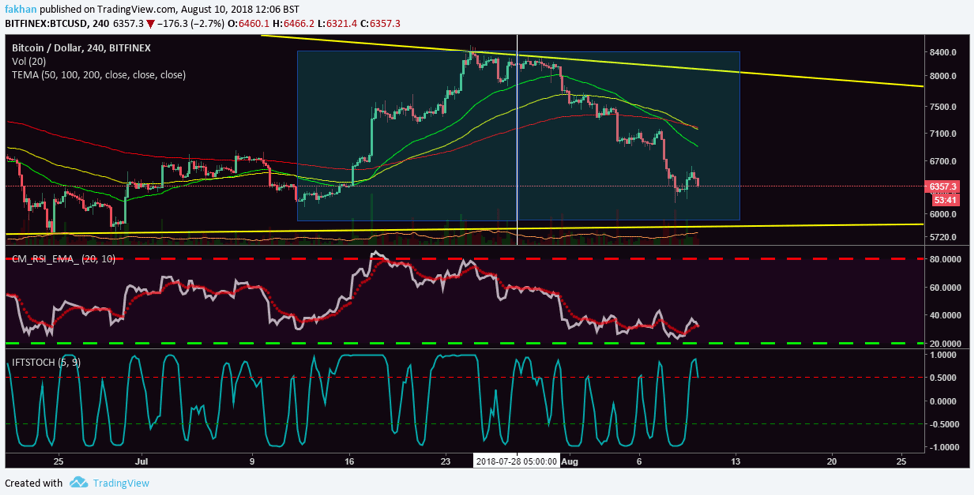
Bitcoin (BTC) has certainly not reached the full extent of this correction as the 4H chart for BTC/USD above shows. However, there is not enough interest to call for a rally at these levels. A few months back, many would have thought that a drop to $6,000 was never to be seen again and that the price has already reached the bottom. Today, that sentiment has changed. More investors and analysts are now more convinced than ever that the bottom is yet to be found. There are those with ultra bearish expectations like a drop to $4,000 or below, which although being possible is definitely not likely.
However, it is important for bullish sentiment to be completely shattered before a new cycle can begin. So long as there are weak hands in the market, the price will continue to go down. As the above chart shows, Bitcoin (BTC) started to climb around July 12 and peaked around July 25. After that, the price started to fall and has yet to reach a bottom. The bullish and bearish fractals are mirror images of one another, showing how Bitcoin (BTC) price pumped and then dumped in a period of approx one month. Until Bitcoin (BTC) finds a bottom, whales and professional traders will keep on preying on overly optimistic bulls to their advantage.
