


The crypto market went through another wave of crashing cryptocurrencies in the last 2 weeks. The panic among crypto investors was high, and we are sure that many crypto holders were not able to manage their emotions resulting in selling their favorite crypto which they likely picked up at much higher prices despite InvestingHaven continuously warning to remain calm. The point is this: Bitcoin is still in a bull market in 2018. It may not feel that way, but the charts confirm our viewpoint. This article features 5 must see charts confirming the Bitcoin bull market of 2018, and, with that, the crypto bull market as well.
InvestingHaven’s research team, publisher of the first blockchain & crypto research service in the world, sent an email alert to premium subscribers on August 8th, in the midst of panic in the crypto market, with the title “Get ready for the puke phase in the crypto market”. This is a quote from the crypto research service:
Let’s re-phrase today’s situation. WE ARE IN THE PUKE PHASE! Anyone who can stand this will be very glad later down the road. The only thing we do not know exactly is when will you be glad, we can only work with ranges, and estimate it’s somewhere between 12 and 18 months.
Our expertise is meant to guide you, and avoid making emotional mistakes. If anything, in those 2 decades that we are involved in markets, we have seen that emotions lead to one, and only one, result: a disaster!
Please stay rational.
Many crypto investors reached out to us, thanking us for this great advice!
However, we are convinced that many crypto investors who do not have this type of support and coaching were not able to stomach this situation, especially the selloff in altcoins, and may have lost a great opportunity to hold great crypto for the long term.
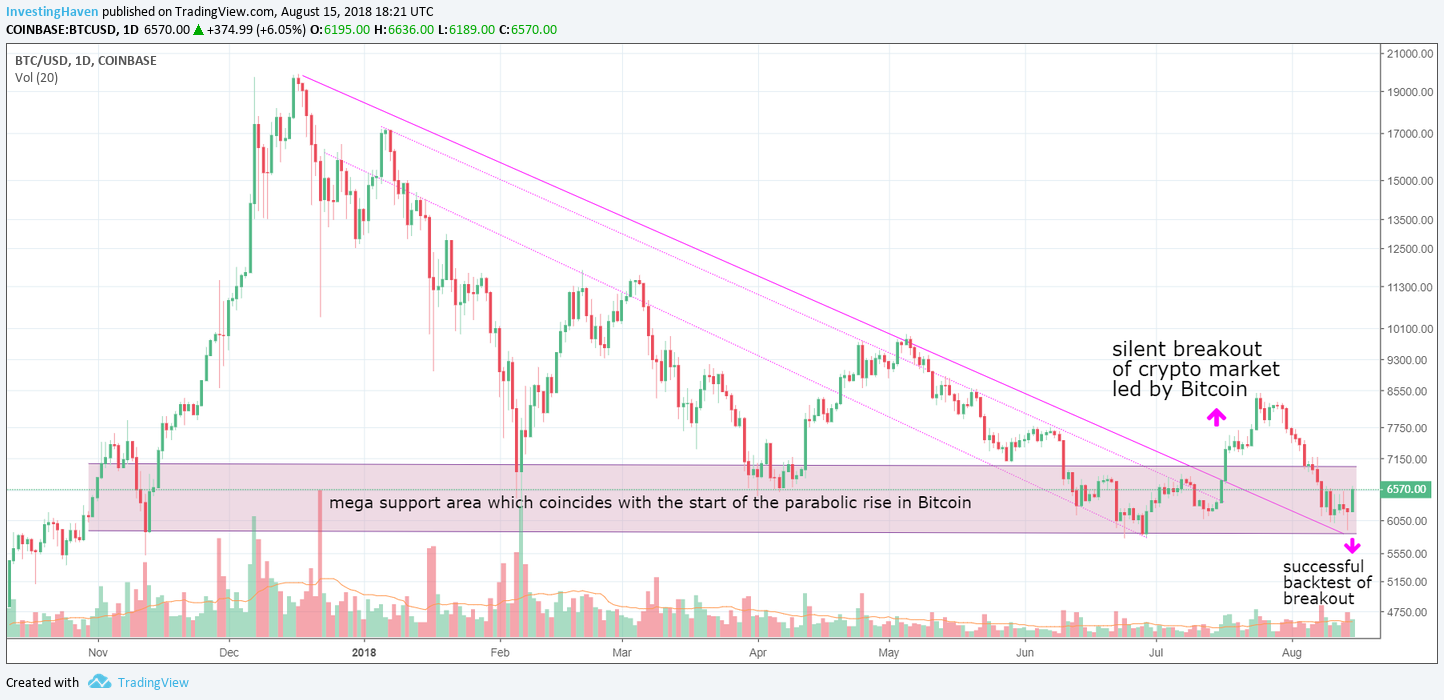
Bitcoin is still in a bull market in 2018 (chart #1)
As said many times Bitcoin is the leading indicator. It was the first cryptocurrency to set a major peak in December 2017, only to crash as the rest of altcoins were rallying like crazy.
The opposite is true as well. Any leading indicator should be watched in a selloff, is the golden rule, says InvestingHaven’s research team. Bitcoin is the only crypto to watch today, as that’s the one indicating whether the grand crypto bull market is still intact. Forget Ethereum and other altcoins for a moment, Bitcoin is the leading indicator! That’s the crucial insight InvestingHaven has continuously shared with its premium subscribers.
The first chart makes the point. We published mid-July of this year: Crypto Market Breaks Out. InvestingHaven Flashes A Buy Alert.
Bitcoin broke out, and it was the only cryptocurrency that should have been watched at that point in time. A strong rally to $8500 followed, and, quite sudden, a sharp retracement started on July 30th 2018.
Since then, there was a non-stop selloff. Especially altcoins got sold hard since then. It’s fair to say this was a crypto crash!
Today, we find ourselves in a situation that we forecasted as well: watch the retracement, as it may test the breakout level. And that’s exactly what happened. The breakout got tested successfully, which means the breakout is confirmed. This is not only important for Bitcoin, it is much more important for all cryptocurrencies and blockchain stocks.
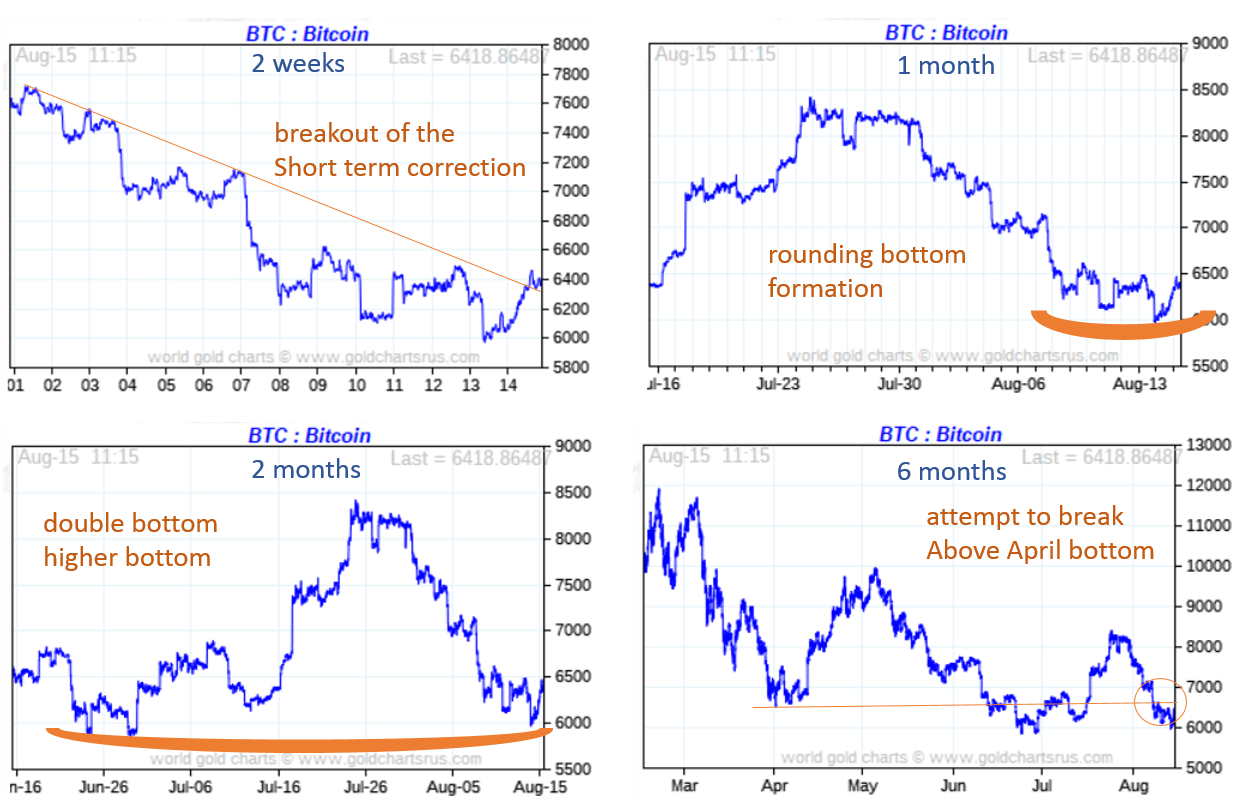
Must see Bitcoin charts confirming the 2018 bull market
Below’s 4-in-1 chart collage is a beautiful collection of 4 different timeframes.
The golden rule is to always look in a top-to-bottom fashion into any market. The daily chart embedded above shows the large trend. Zooming into the lower timeframes reveals much more details.
The 2 week Bitcoin chart makes the point that Bitcoin broke out today. Forget all the negativity around Ethereum, Ripple, and all other altcoins. Bitcoin is the leading indicator, we only watch Bitcoin to identify trend reverals, in both directions!
The 1 month Bitcoin chart shows a beautiful rounding bottom formation, very bullish
The 2 month Bitcoin chart is a super important one: it shows a huge double bottom against the June 28th lows! Make no mistake, this is huge news, so important that financial mainstream media simply does not “see” it.
The 6 month Bitcoin chart is also crucial from the perspective that it shows current prices compared to the April lows. Former support must be broken to the upside now, which is what Bitcoin is attempting to do.
The conclusion is simple: if all 5 Bitcoin charts, on different timeframes, confirm each other, then crypto investors can be sure that the grand crypto and Bitcoin bull market is still intact in 2018, without any doubt. The more timeframes confirm each other’s trend, the higher the probability of an accurate conclusion.
Note: Premium subscribers receive detailed insights today about the recent altcoins crash. It was the subject of many questions we received, so we decided to dedicate a special crypto alert. Want to receive it as well? Very simple, become a member NOW and get access to all crypto alerts >>
Crypto market BREAKOUT: InvestingHaven flashed a BUY alert on July 18th 2018. Top notch guidance on how to play this breakout, tips on establishing a future proof crypto portfolio, our selection of 10 top cryptocurrencies and blockchain stocks. Go to our Blockchain Investing Service >>
