


The silver price is crashing more than 4 pct just today, August 15th 2018. In the first two weeks of August the price of silver lost 7.7%. The crash is more outspoken when compared to the peak of mid-June 2018: the silver price crash is 17.2%. Is the silver price crash of 2018 near an end? The answer is YES we are near a major bottom, this is why!
The silver price crash 2018: why?
The first question that silver investors try to sort out is “why is this silver price crash taking place?”
This of course, intuitively, leads investors to check the news. However, that’s the wrong place to look at.
Forget about the news. The news will of course be very bearish at this point in time, what else would you expect. Try to be empathetic: if you are a journalist and you have to write about the silver price crash of 2018 what would you do? You certainly would not look for reasons to be contrarian and look for a potential reversal. The more scary the headlines, the better, from a mainstream media perspective.
At InvestingHaven we apply the 1/99 rule: only 1% of the news is relevant to investors. We consider a monthly chart as one of the important news items even if mainstream media is reluctant to analyze charts and translate it into news.
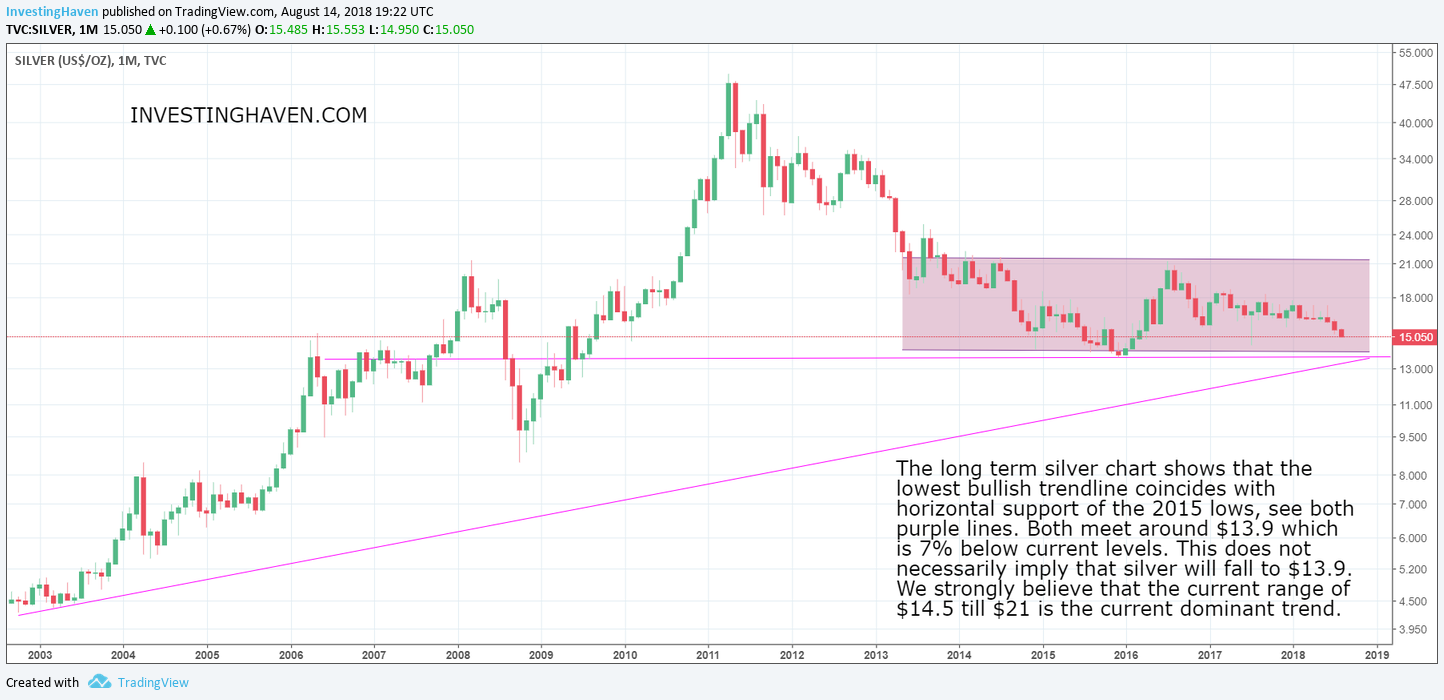
The silver price crash 2018 vs. the long term trend
When evaluating a crash, any crash, including the silver price crash of 2018 or 2015, it is mandatory to take the top-down approach. The monthly chart is the first and most important one to check.
The monthly silver price chart outlined below shows the rising bull market trendline which connects the lows of 2003. Note how this trendline comes in at $13.2 at this point in time, and $13.5 at a later point in 2018.
Note on the same silver price chart how horizontal of the 2015 and 2016 bottom comes in at $13.9.
There is so much support on the monthly silver price chart in the $13 to $14 area that we forecast the silver price crash 2018 to end sooner rather than later.
This is not a time to short the silver market, this is a time to monitor it closely, and determine a good entry point, ideally as the precious metals market calms down. There is no sense in trying to ‘catch a falling knife’, it is wise practice to give things some time and get a confirmation of a bottom.
Let’s face it: this silver price crash in 2018 has nothing to do with the silver crash of 2013, and certainly not the Silver Thursday crash of 1980.
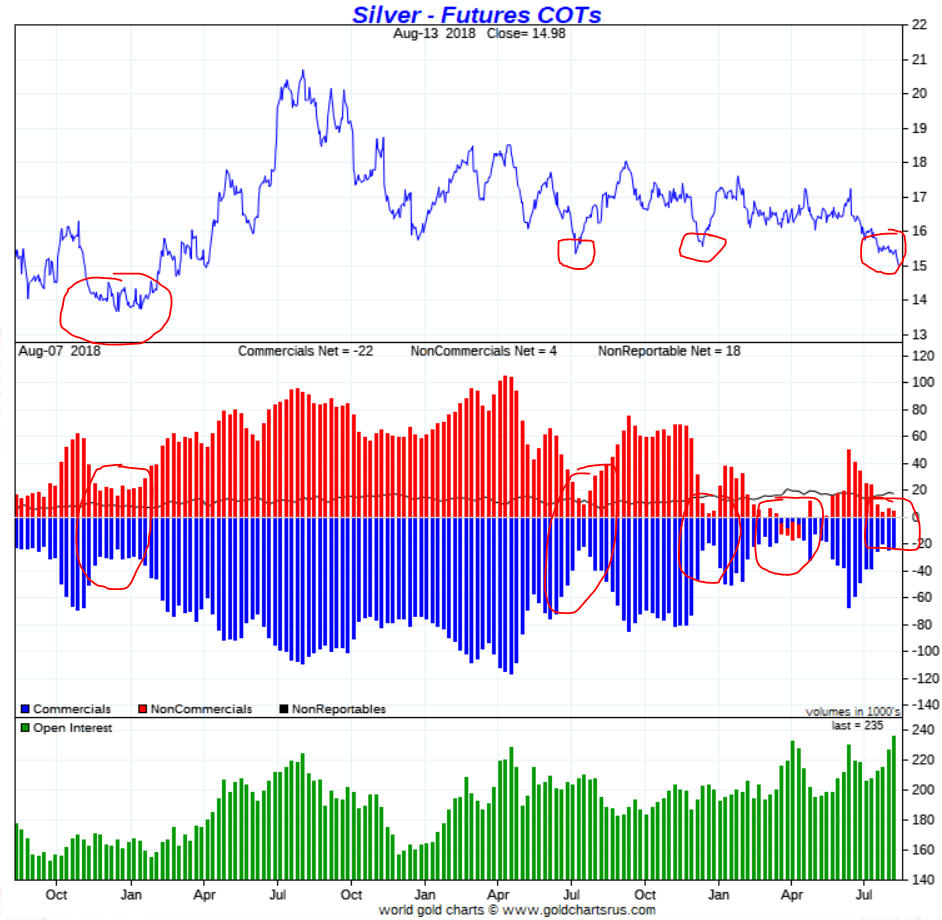
The silver price crash 2018 in the futures market
One of the scenarios that may be playing out right now is a higher low against the 2015 and 2016 bottom. We explained recently how we read the futures market COT report, see Gold Market Writing History In 2018 and Gold Futures Market At Extremes, Suggests Gold Price Bottom Set For 2018.
The point is that silver is writing history with its extreme futures market positions. Below is the silver futures market chart with the positions of the largest market participants.
How to read this chart? The extreme levels in center pane are the ones to focus on. The closer positions to the zero line, the deeper the bottom that will be set. This may vary if the silver market is in a bull market vs a bear market, but the point is that extreme positions cannot last for a long time.
Note how each previous instance of similar readings got followed by a powerful short to medium term rally, see red circles on the chart.
The silver price and silver COT report suggest a major bottom is being set
Crypto market BREAKOUT: InvestingHaven flashed a BUY alert on July 18th 2018. Top notch guidance on how to play this breakout, tips on establishing a future proof crypto portfolio, our selection of 10 top cryptocurrencies and blockchain stocks. Go to our Blockchain Investing Service >>
