


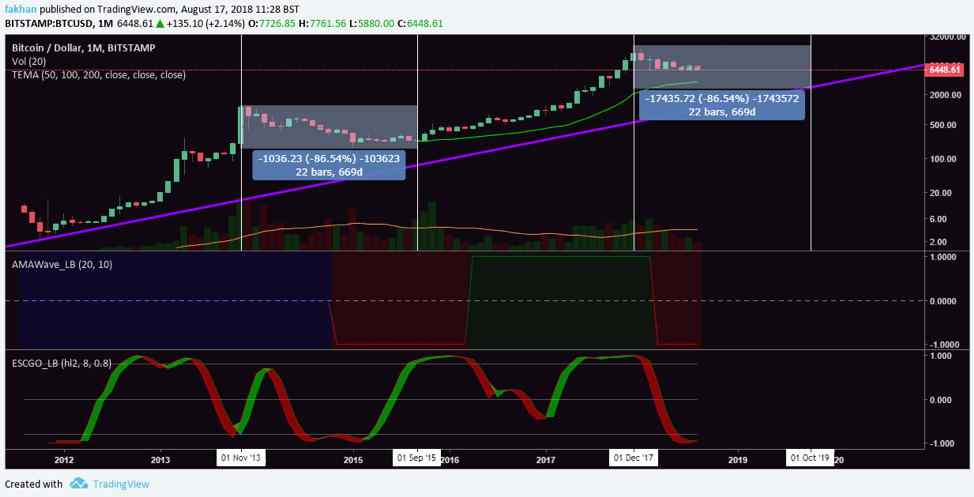
Monthly Chart for BTC/USD
The popular sentiment right now is that Bitcoin (BTC) is going down. Nobody can say for sure how low it is going to fall but most people are convinced that this is certainly not the end of this correction. As the chart above shows, Bitcoin (BTC) completed a correction of 86.54% between Nov 2013 and Sep 2015. A significant majority is of the view that this scenario is likely to unfold this time. If this were to happen, Bitcoin (BTC) would have to complete a correction of 86.54% in a period of 669 days which comes down to Oct, 2019.
Your immediate reaction to this analysis would be, “What about the ETF? Is that not going to push the prices higher or are we not going to get an ETF till 2020?” Well, the question sorts of answers itself. If a 2014 styled scenario were to unfold, it would mean that we are just about to enter a bear market. So far, we have not entered a bear market as the BTC/USD price has remained above the 50 EMA on the monthly timeframe. That downtrend would then have to last for another two years, despite everything that is going on in the cryptocurrency space and the correction that we have already had.
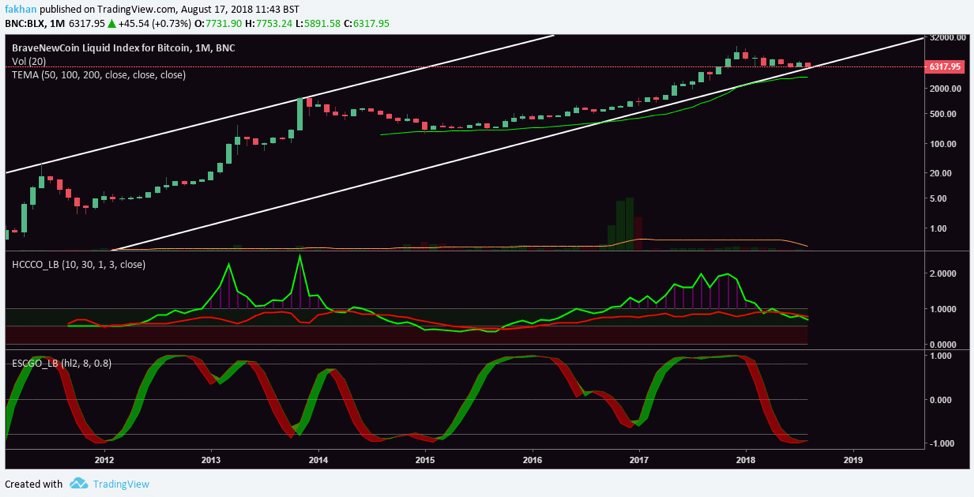
Monthly chart for Brave New Coin Liquid Index for Bitcoin: BNC:BLX
This monthly chart for BNC:BLX shows a slightly different picture than the one before as it covers one extra month that the chart from Bitstamp does not. Most charts circulating in Bitcoin (BTC) forums date back to 2012 at most. Some analysts even base their analyses on charts dating back to 2013. In technical analysis, the more data there is, the more accurate the comparison is, because history may not repeat but it does rhyme.
As the above chart shows, the price of Bitcoin (BTC) would have bottomed out according to this scenario, taking into account data since 2011. Even on this chart, the price has not broken below the monthly 50 EMA which means the price can be expected to bounce off the 50 EMA even if it falls below the trend line in the months ahead. However, the most likely scenario is that the price is not going to fall further and the bottom is already in.
The HCCC Oscillator on the above chart shows a very interesting development. The green line of the HCCCO indicator shows the fast oscillator and the red line shows the slow oscillator. As you can see, during the beginning of the correction in 2014, the green and the red line are further apart as the correction begins. However, in 2018, the green and the red lines are closer, which means a few large orders could push the green oscillator above the red one and the price of Bitcoin (BTC) will shoot up as it did between 2012 and 2013.
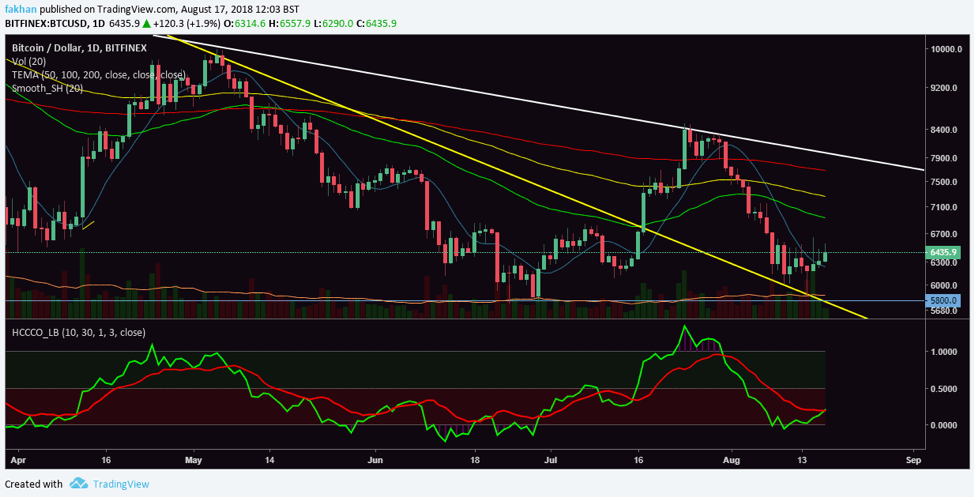
Daily chart for BTC/USD
The chart above for BTC/USD shows the price is ready to take off from these levels. Whether or not it will be able to break past $7,700 is not clear yet. The price could fall again after rejection at the new downtrend resistance (white line). However, the question remains, “What is smart money up to?” The answer is simple. Smart money is accumulating Bitcoin (BTC) at these levels while at the same time setting some funds aside in case the price drops further. That way, even if the price falls, they can buy more to lower their dollar cost average as long term, most investors are now convinced, more than ever, that Bitcoin (BTC) is headed higher.

