


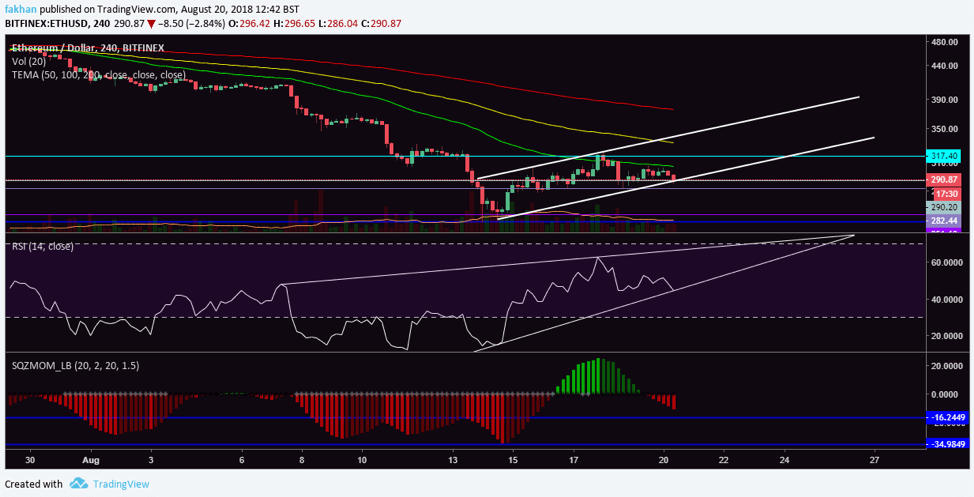
Ethereum (ETH) has entered an ascending channel on the 4H chart for ETH/USD above but the price action appears very weak and likely to break this trend in the near future. RSI analysis for the above chart shows that the price is on the verge of a steep decline which could take place in the coming days. Considering the level at which the price of Ethereum (ETH) is currently at, it would be interesting to see if it will break support during the next wave down.
So far, the price has a chance to continue upwards from here but the climb will not be easy. Ethereum (ETH) faces two strong resistances short term, one is the 50 EMA resistances which has historically been the harshest on Ethereum (ETH) compared to all cryptocurrencies. Since the beginning of the correction, Ethereum (ETH) has had a very hard time breaking above the 50 EMA and has failed more than 10 times now. The support at $290 is adequately strong considering it is also supported by the ascending channel, but the near term resistance of 50 EMA is a lot stronger. Ethereum (ETH) did manage to break The 50 EMA resistance on August 17, but that soon turned out to be a false signal and the price crashed hard. Even if Ethereum (ETH) manages to break the 50 EMA resistance again, it will face an equally strong resistance of $317, which it has failed to break past, three times this month.
Squeeze momentum profile for Ethereum (ETH) on the above chart suggests that there is still further room to fall. However, whether the fall will be to the first blue level or the second one on the above SQZMOM profile is yet to be seen. Ethereum (ETH) now has two choices: either it will retest the $250 support again to form a double bottom, or it will test the support to break below it and trigger another bear trend. At this point, when the market seems to be recovering, it does not seem likely that a new bear trend would last for long. The most likely scenario is that Ethereum (ETH) will continue to trade sideways to consolidate before the beginning of its next bullish cycle.
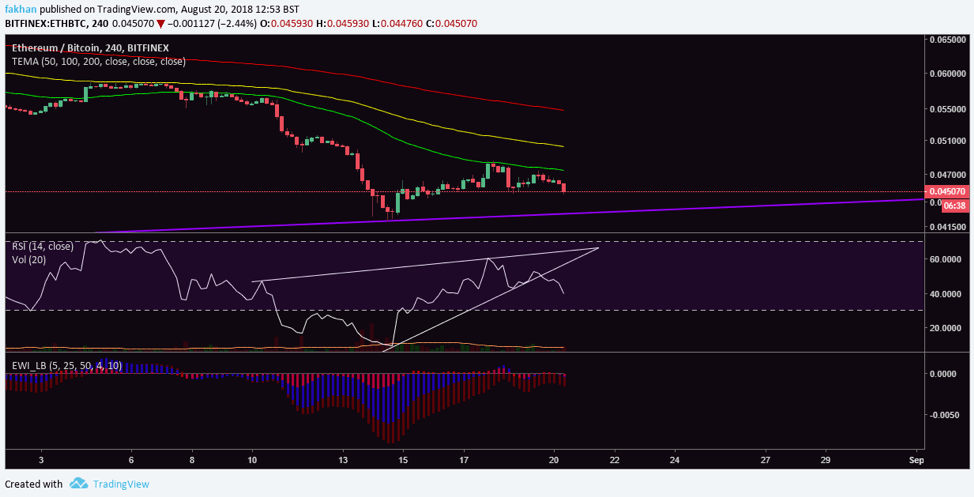
Ethereum (ETH) has just faced rejection at the 50 EMA on the ETH/BTC 4H chart above. Considering this happened over the weekend, it is likely that this is a false signal. However, RSI for ETH/BTC has been in a rising wedge for a long time now and it had to break out of it at some point in order for the price to retrace. The fact that Bitcoin (BTC)’s dominance has run into a historical resistance and that an altcoin rally could be a around the corner, it does not make much sense to expect Ethereum (ETH) to break a critical support and enter a long term downtrend against Bitcoin (BTC).
The more plausible explanation is that this recent price action is indicative of bot activity during the weekend which has been further exploited by traders to their advantage in the wake of low volume. However, as the dust settles, we should see Ethereum (ETH) begin a new cycle against Bitcoin (BTC) from these levels.


