


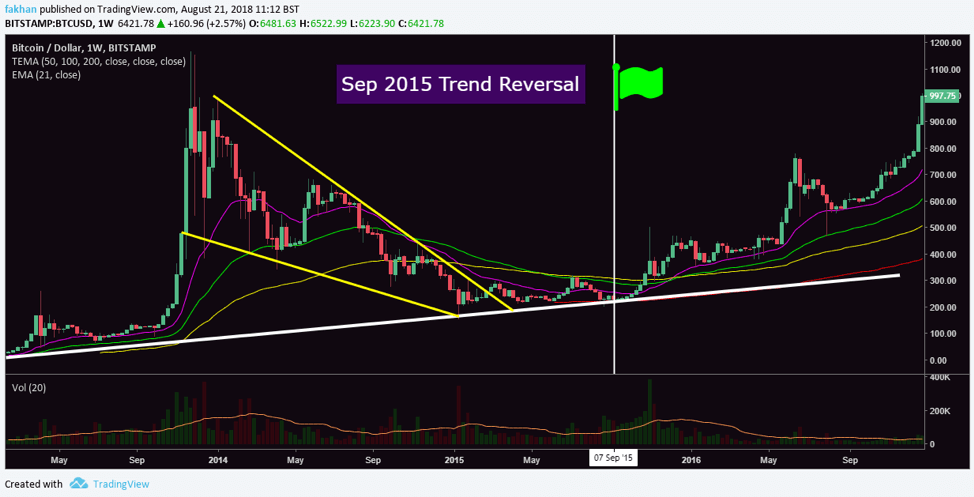
If this weekly chart for BTC/USD did not have any labels, or if it displayed the period till August only, most of you would have mistaken it for the current chart of Bitcoin (BTC). Why do you think that is? The answer is simple. History may not repeat but it does rhyme. No wonder the price action for BTC/USD in 2014-15 appears to be a carbon copy of the current price action. On closer inspection, you might be able to tell a few differences, but nothing significant.
As you can see on the chart above, the price topped out around $1,000 and then entered a correction. The price continued to decline, trading inside a falling wedge. Then the price breaks out of the falling wedge and consolidates before beginning a new rally in September. The EMA alignment is exactly the same as it is now. The price action and general movements are in sync with the ones we have now. The price manages to stay above the trend line and the volume keeps on declining towards the end of the correction.
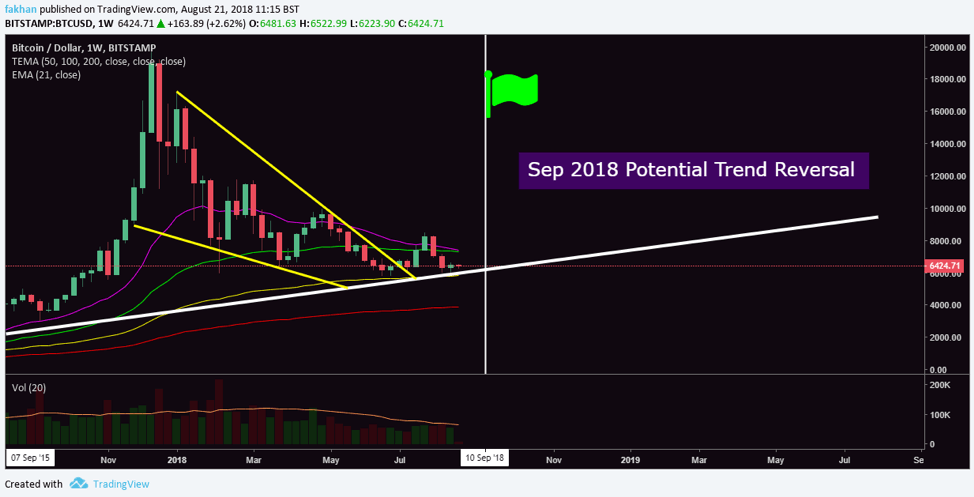
This is the current weekly chart for BTC/USD which clearly shows how closely we are following the same pattern as that of 2014-15. The price traded in a falling wedge since the correction, broke out of it, managed to stay above the trend line, touched the trend line once and is now on the verge of a trend reversal. Interestingly enough, the price is expected to begin a new cycle in September this time as well! The EMA alignment and he volume profile all look very much alike. The best part is that this similarity is not just a coincidence. Technical analysis would have suggested a reversal at this point regardless of any similarity with the past. The reason we have had such a similarity and will continue to have similar patterns in the future is because of a Bitcoin (BTC) phenomenon known as halvening.
We know from an analysis of the history of Bitcoin (BTC) that every time before a halvening occurs, a period of massive accumulation precedes it. The first halvening occurred in Nov 2012, before which we saw a massive rally. Then again a second halvening occurred July 2016 before which we saw a huge rally in 2015-16. The next halvening is in mid 2020 and it makes every bit of sense to expect that Bitcoin (BTC) will see a period of massive accumulation in 2018-19 before the next halvening, especially now that there is enough historical data for big investors to see the recurring pattern.
Bitcoin (BTC) has had a lot of success so far but we are still far away from significant adoption. Upcoming developments like Bitcoin ETFs, custody solutions, favorable regulations, institutional involvement and merchant acceptance are the real catalysts that will take us to that next level of adoption. Holding Bitcoin (BTC) right now is no different than having a mobile phone when everyone was using telephones. It takes time but soon everybody starts seeing the point.


