


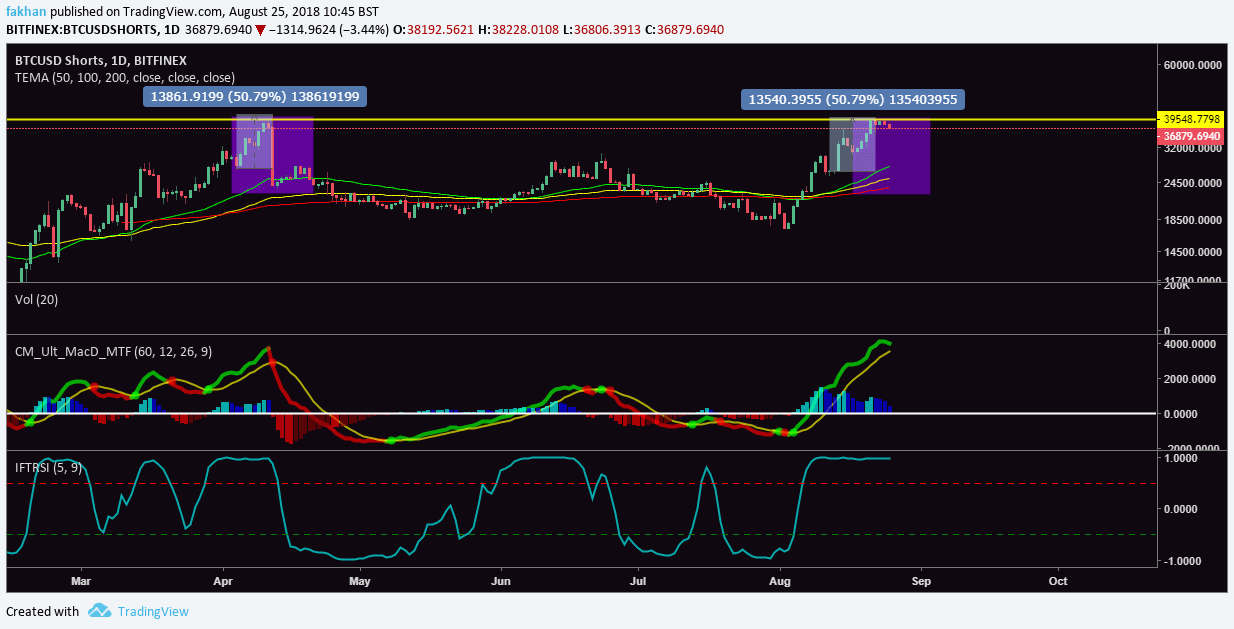
Bitcoin (BTC) is now at a critical point as Bitcoin Shorts reach all time high as can be seen on the daily chart above for BTCUSDShorts. The last time the number of shorts for Bitcoin (BTC) was this high, we witnessed a massive short squeeze which liquidated a large number of short positions and hurt the bears badly. Before the massive short squeeze there was a 50.79% rally after a red candle in April 2017 for Bitcoin Shorts as can be seen on the chart above.
Interestingly enough, we have had a similar rally of an exact 50.79% after a red candle in August 2018. If history is any indication, the number of shorts should now drop massively as a result of a massive short squeeze. How and when that happens is not yet known but it is clear that the bearish momentum is lost and the number of shorts has declined after reaching the previous all time high. The number of shorts is expected to nosedive in September, the same time at which a trend reversal for Bitcoin (BTC) is expected.
MACD analysis for the above chart confirms our hypothesis as the green line has come closer to the yellow line and is likely to break below it in early September if not before. IFT Stochastic conditions have also been trading in an overbought range for long enough and now risk a correction, which means the number of shorts could drop drastically in the weeks ahead. This would result in a massive short squeeze which will remove sell pressure from the market and the price of Bitcoin (BTC) would spike in the form of big green candles in a matter of just a few days.
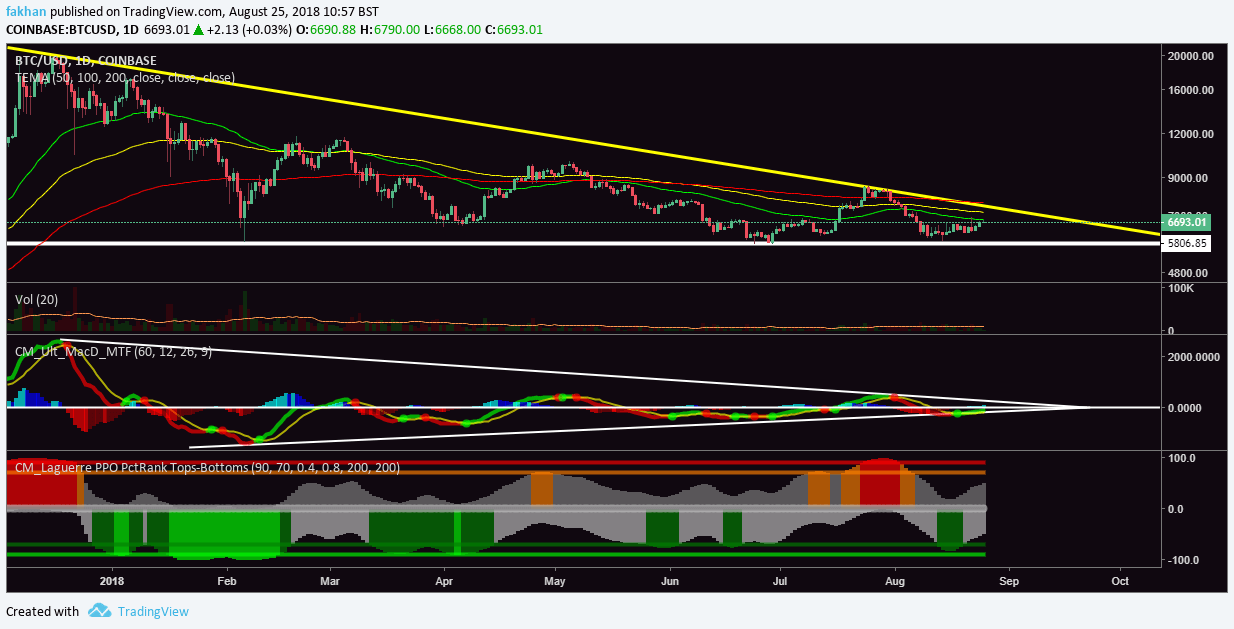
The above daily chart for BTC/USD shows that the price of Bitcoin (BTC) has almost reached the extent of its movement within the triangle it has been trading in. Now, the price faces a minor resistance at the 50 EMA, breaking which it could shoot up to test the downtrend resistance. However, there is also a possibility that the price might get rejected at the 50 EMA and test the support at $5,800 again. In any case, the price is expected to bottom out completely by September at the latest. As Bitcoin (BTC) trades further down the triangle, it becomes easier to break the downtrend resistance.
MACD profile for the above chart shows that Bitcoin (BTC) is about to change its trend by early September. The price seems to have already found a bottom but will continue to trade sideways for the next few days until buyers get onboard. The volume continues to decline and the EMA alignment is still bearish but the bears no longer seem to be in control. Just as at it seemed so easy for the bears to push the price down from Bitcoin (BTC)’s ATH of $20,000, it has become similarly easy for the bulls to turn things around at this point.
