


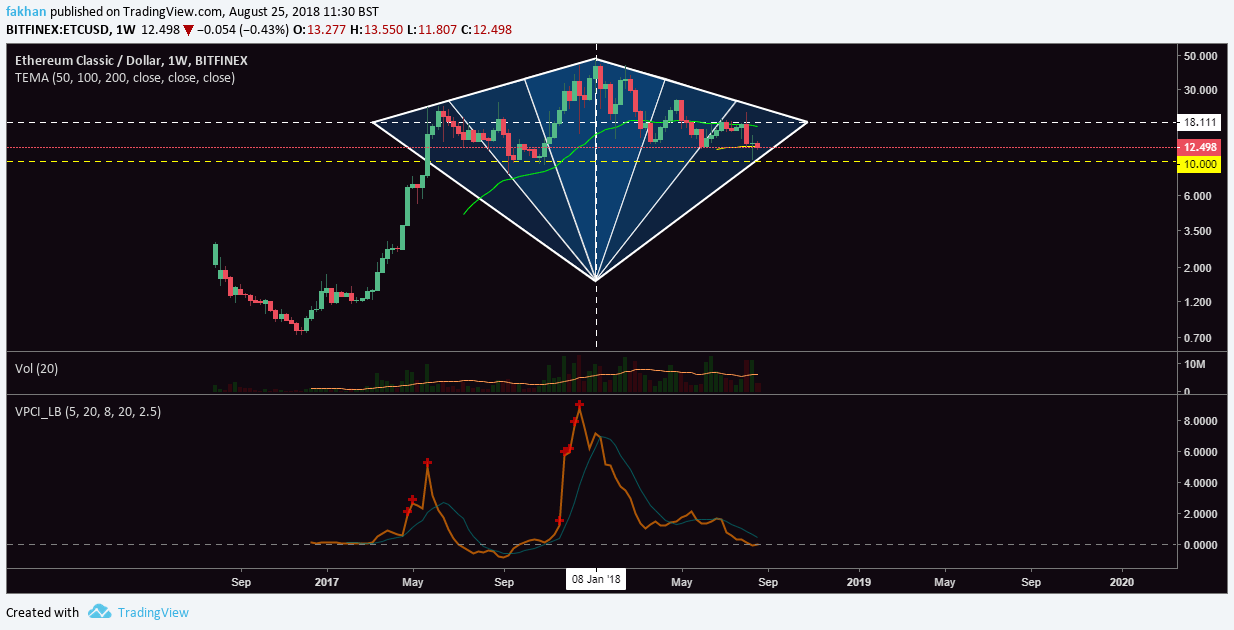
Ethereum Classic (ETC) has long been hailed as a hidden diamond in some crypto circles. This time, the whole crypto community can literally see what it really meant. It is true that Ethereum Classic (ETC) is a rare diamond of a blockchain project, but that is not what we are talking about. The weekly chart above for ETC/USD shows exactly what we are talking about. This is called the bullish diamond formation which is a continuation pattern in technical analysis. It means that if the price was falling before it entered the diamond formation; it will continue to fall more aggressively after exiting the diamond. However, if the price was rising before entering the diamond, it will continue to rise more aggressively after exiting the diamond formation.
In the case of Ethereum Classic (ETC), the price was rising before entering the diamond formation and that too on the weekly timeframe. This means that there is a very high probability that the price is going to skyrocket after exiting the diamond formation. As the chart above shows, this pattern has not been invalidated even a single time and the diamond formation has remained intact since 2017. It also shows that we have just a few weeks to break out of this diamond. This coincides with early September, which is the same time a trend reversal is expected for Bitcoin (BTC) and the overall market.
Volume Profile Confirmation Indicator on the above chart further confirms our analysis that Ethereum Classic (ETC) is due for a trend reversal in early September. As you can see on the VPCI indicator on the ETC/USD chart, the distance between the orange and blue lines is starting to decrease and the orange line is expected to break above the blue line in early September. The VPCI indicator is also at the same level as it was back in 2017 when the bullish breakout occurred.
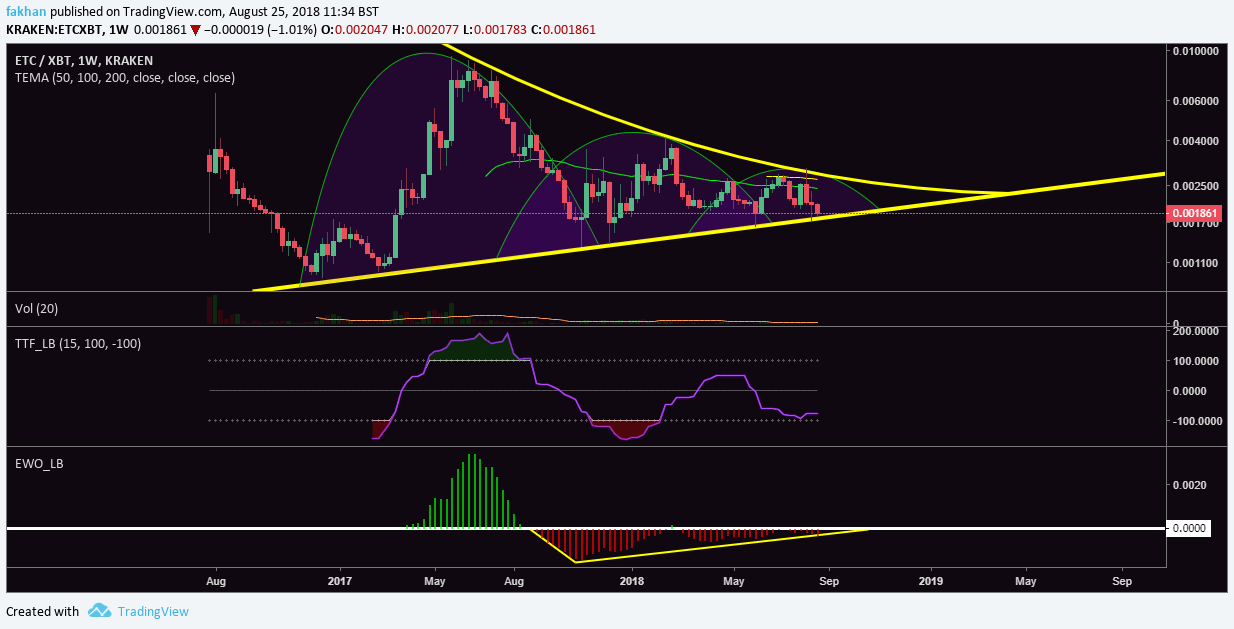
The ETC/XBT weekly chart above shows how Ethereum Classic (ETC) is about to begin a new cycle against Bitcoin (BTC). It is easy to manipulate markets on lower timeframes especially when the volume is this low. However, long term trends are a more accurate depiction of what is likely to happen next. As the chart above shows, Ethereum Classic (ETC) is yet to break out of the downtrend resistance against Bitcoin (BTC) but it seems to have reached the extent of its movement against Bitcoin (BTC) in the triangle on the above chart. The TTF indicator shows that ETC/XBT has bottomed out and is now due for a trend reversal in the weeks ahead.
Elliot Wave Oscillator on the above chart also shows that the sell pressure on Ethereum Classic (ETC) has been on a constant decline since September 2017. It has now reached a point where the bulls are more confident in taking risk compared to the bears. Ethereum Classic (ETC) still ranks in the top 10 in terms of daily trading volume. After its recent listing on Coinbase and Robinhood along with the additoon of new fiat pairs for ETC on popular exchanges, interest in Ethereum Classic (ETC) is expected to skyrocket once the market recovers.
