


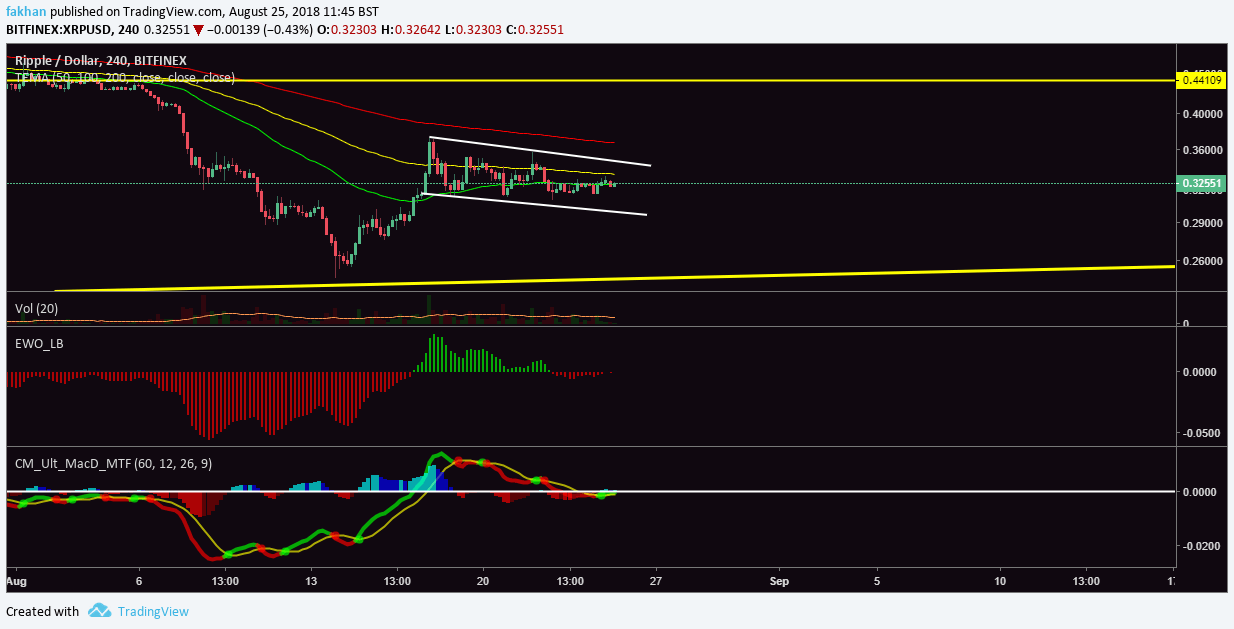
Ripple (XRP) has just formed a big bull flag on the 4H chart for XRP/USD. The price has found immediate resistance at the 50 EMA but a breakout is expected in the days ahead. The EMA alignment on the 4H timeframe continues to remain bearish. However, Elliot Wave Oscillator on the same timeframe signals a reversal in the days ahead. The bearish momentum that was on a rise since August 6 now appears to be lost completely. MACD analysis for the above chart also shows that the price is at the point of a short term trend reversal and is expected to rise until it reaches the $0.44 level.
Volume for Ripple (XRP) has generally been on a steady decline since the beginning of the correction, with minor outbreaks of hope but the trend has continued to remain bearish on larger timeframes. Ripple (XRP) has had one of the worst corrections among all cryptocurrencies, currently down more than 90% since its all time high of $3.40. The sentiment on platforms like Twitter and Reddit continue to be very bullish. Ripple (XRP) investors are also more vocal than the rest and probably more optimistic as well. Every announcement of a partnership is met with extraordinary enthusiasm and optimism even when the actual impact of those partnerships on the price of XRP is not clear yet.
It was expected that this correction would result in investors giving up long shot coins like Ripple (XRP) for ones with actual work cases like Bitcoin (BTC) or Ethereum (ETH). However, the number of Ripple (XRP) investors does not appear to have been significantly affected by all the bad press and negative developments during the past few months. Even though financial giants like Western Union have clearly signaled that Ripple (XRP) has had no impact on their transaction costs, Ripple (XRP) investors are still confident that some time in the future, it will. Most of them also believe that Bitcoin (BTC) is an outdated technology compared to Ripple (XRP) and that eventually, Ripple (XRP) will dominate the forex market with banks using XRP instead of fiat currencies. This dream of capturing a trillion dollars forex market seems to have attracted plenty of investors towards Ripple (XRP) and that is what keeps them invested in Ripple (XRP).
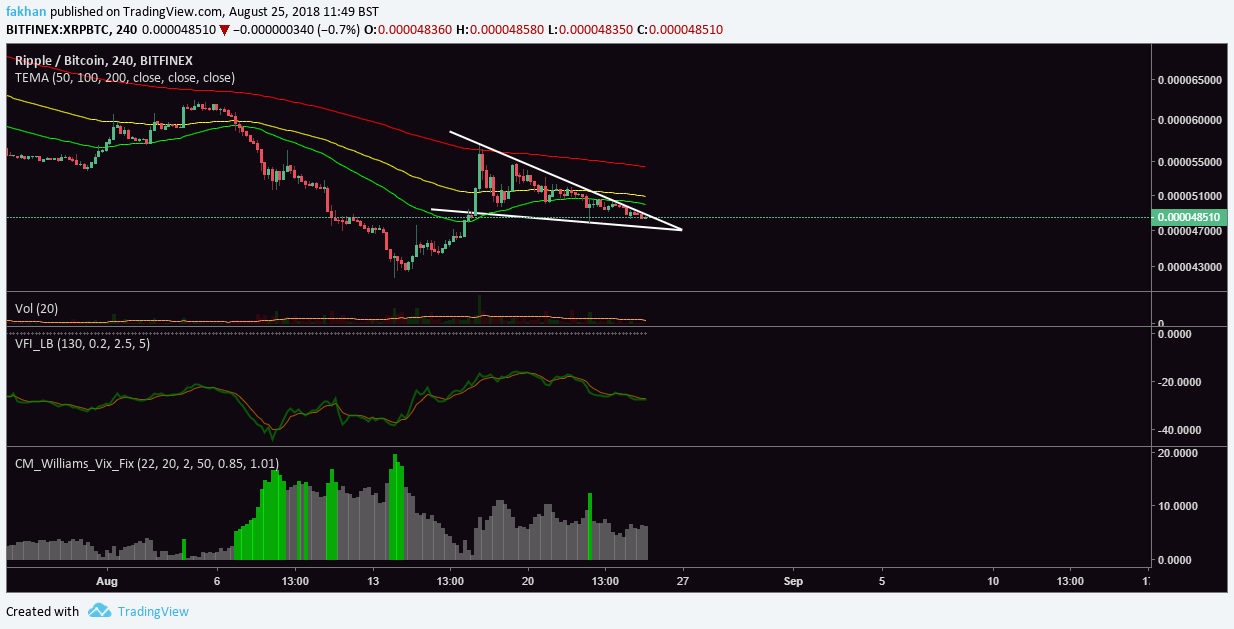
The above 4H chart for XRP/BTC shows that Ripple (XRP) is due for a breakout against Bitcoin (BTC) in a day or two. The VIX profile for Ripple(XRP) against Bitcoin (BTC) shows that it found a temporary bottom, indicated by a solo green bar on the VIX profile. The Volume Flow Indicator on the same chart shows how the price is expected to rally over the next few days. There is a temporary resistance at the 50 EMA but a breakout from this triangle will likely push Ripple (XRP) above the 100 EMA after which it is likely to face temporary resistance at the 200 EMA. Long term prospects for Ripple (XRP) still appear bullish and this is just the beginning of a series of breakouts that might push the price of Ripple (XRP) to a new all time high in 2019.
