


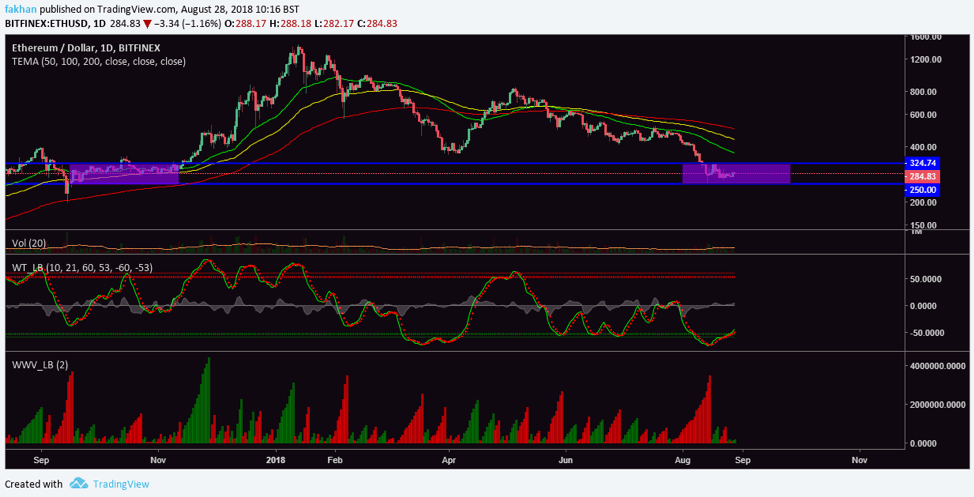
Chart for ETH/USD (1D)
Ethereum (ETH) has entered the same phase as it was in back in 2017 when the price consolidated before a big run up. A lot of investors have been expecting an explosive Q4 for cryptocurrencies since the beginning of this correction. The current price action confirms that could be the case as Ethereum (ETH) has now entered in a consolidation phase after completing an extensive correction. The price is expected to consolidate all the way till mid September before beginning a new cycle.
Very few of us have been in this space since the early days when there used to be just a few coins. At the beginning of every new cycle, the popular sentiment would be that we have had massive gains in the past but all that is over now, meaning that now the pace would be a lot slower. However, if you have been around for long, you would know that this was not the case. The market would repeat the same bullish and bearish cycles as usual and long term the market continued to grow.
Ethereum (ETH) has had a 90% correction but many in the crypto community believe that the bubble has burst and the gold rush is over. Many of those analysts are either new observers who do not have prior experience following this market or are biased in their views, because I can tell you for a fact that I was around when Bitcoin (BTC) fell from $10 to $2 and most people thought that was the end and that the bubble had burst. This happened again when BItcoin (BTC) fell from $1000 and now it has happened again as Bitcoin (BTC) fallen from $20,000 along with the rest of the market, including Ethereum (ETH).
For the past few days, Ethereum (ETH) has maintained its consolidation mode. Wave trend analysis for the above chart shows that the price is likely to continue to consolidate over the course of a few more weeks. WWV indicator on the above chart shows that big bearish momentum that pushed the price down to it bottom before it entered consolidation, is now fading away.
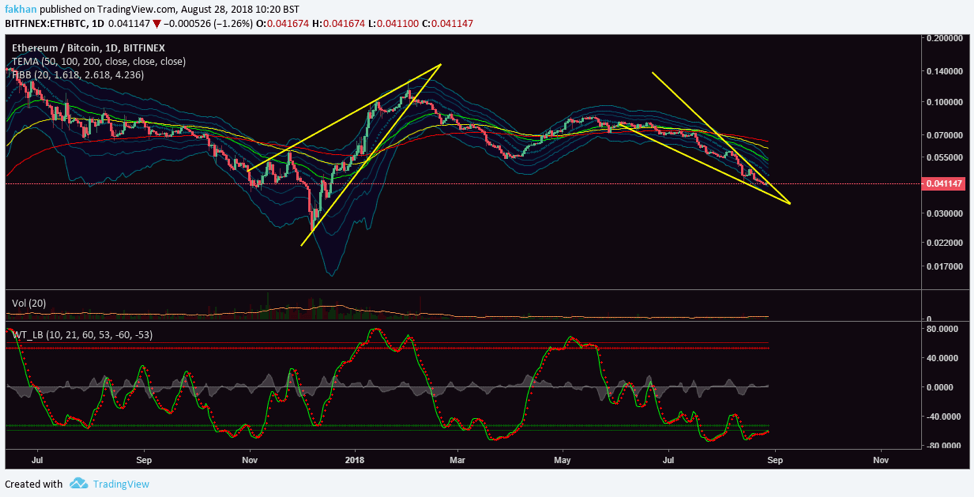
The above daily chart for ETH/BTC shows two wedges, the first one a rising wedge and the second one a falling wedge. These are the two wedges that have acted as turning points for trends reversal for Ethereum (ETH) both during its bullish as well as bearish cycles. Ethereum (ETH) entered the rising wedge back in 2017 when the price braced up for a bull run.
Ethereum (ETH) then traded along that rising wedge till it topped out. After that, the correction set in and the price started to fall soon as it fell below the rising wedge. Similarly, this time the price has entered a falling wedge and has now reached the end of that wedge. This means that after breaking out of this wedge, the price will rise against Bitcoin (BTC) to complete another bullish cycle and possibly reach a new all time high by end of the year.
