


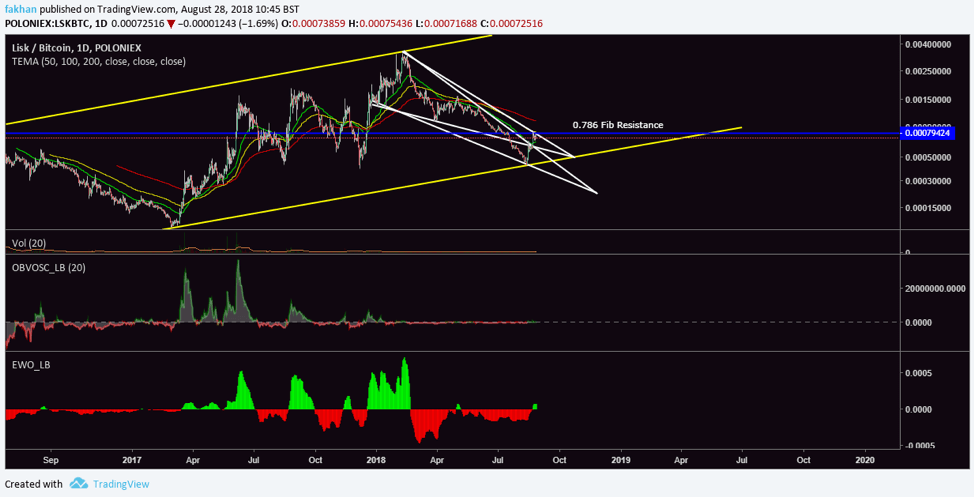
Lisk (LSK) has found resistance at the 78.6% Fibonacci after a bullish spree the past few days. The daily chart above for LSK/BTC shows that Lisk (LSK) has slowed down after its aggressive rise the last few days against Bitcoin (BTC). An altcoin rally is around the corner and investors are looking at different coins to see which one will commence that rally. Lisk (LSK)’s bull run the last few days convinced many analysts that the cryptocurrency has finally found a bottom and is now looking for momentum to begin its bullish cycle against Bitcoin (BTC).
The OBV Oscillator on the above chart looks very favorable for a big run up on LSK/BTC. The 78.6% Fibonacci resistance is a support turned resistance. When Lisk (LSK) broke this support last time, the price tumbled steeply against Bitcoin (BTC) till it bottomed out. This time, if the price of Lisk (LSK) breaks the 78.6% support turned resistance against Bitcoin (BTC) it can similarly be expected to continue its rally higher from there. Elliot Wave Oscillator on the above chart shows that Lisk (LSK) might be able to begin a rally at this point. However, if it does not, then it will have to go for a period of consolidation over the next few weeks.
Lisk (LSK) has held its ascending channel so far and the price seems to be poised for a big run up once it breaks the 78.6% fib resistance. As Bitcoin (BTC) risks falling down to $5,800 in the days ahead, it is likely that Lisk (LSK) will hold ground and then move against Bitcoin (BTC) if the altcoin rally is to begin as expected in September. The volume for LSK/BTC is still very low even on large exchanges. This makes it easy to manipulate short term, but long term, Lisk (LSK) will complete its cycle against Bitcoin (BTC) same as other altcoins.
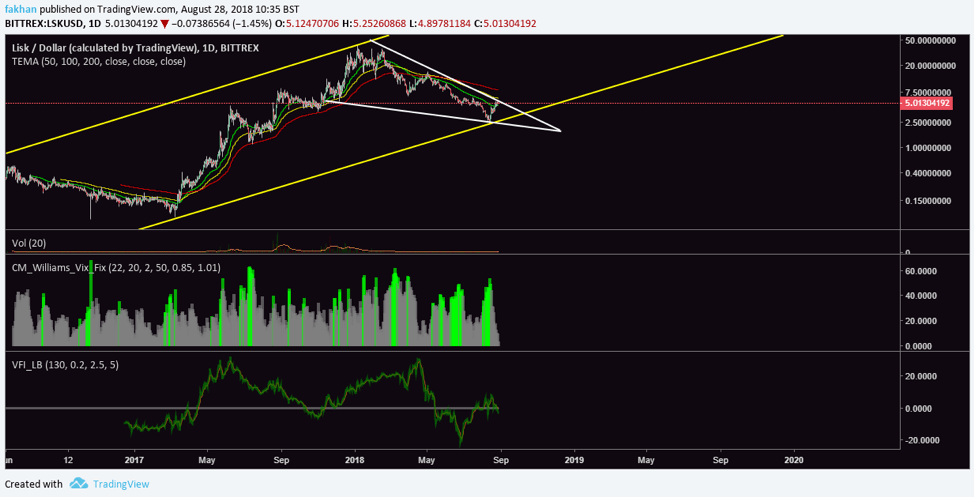
The above chart for LSK/USD shows that Lisk (LSK) is trading in a falling wedge against USD on the daily time frame and could break out of this wedge any time in the near future to begin a new cycle. Lisk (LSK) currently has two choices: either it will have to break the downtrend resistance of the falling wedge to begin a new cycle at this point or it will have to retest the lower limit of the ascending channel before it can attempt to break the downtrend resistance of the falling wedge.
In any case, a breakout from the falling wedge is expected before the end of the year. VIX profile for the above chart shows that there is a high likelihood that Lisk (LSK) has found a bottom against the US Dollar. Volume Flow Indicator for the above chart shows that the price can be expected to complete one wave down before starting a new cycle. Lisk (LSK) has broken the 50 EMA resistance on the daily chart against USD but is currently struggling to break past the 100 EMA.
